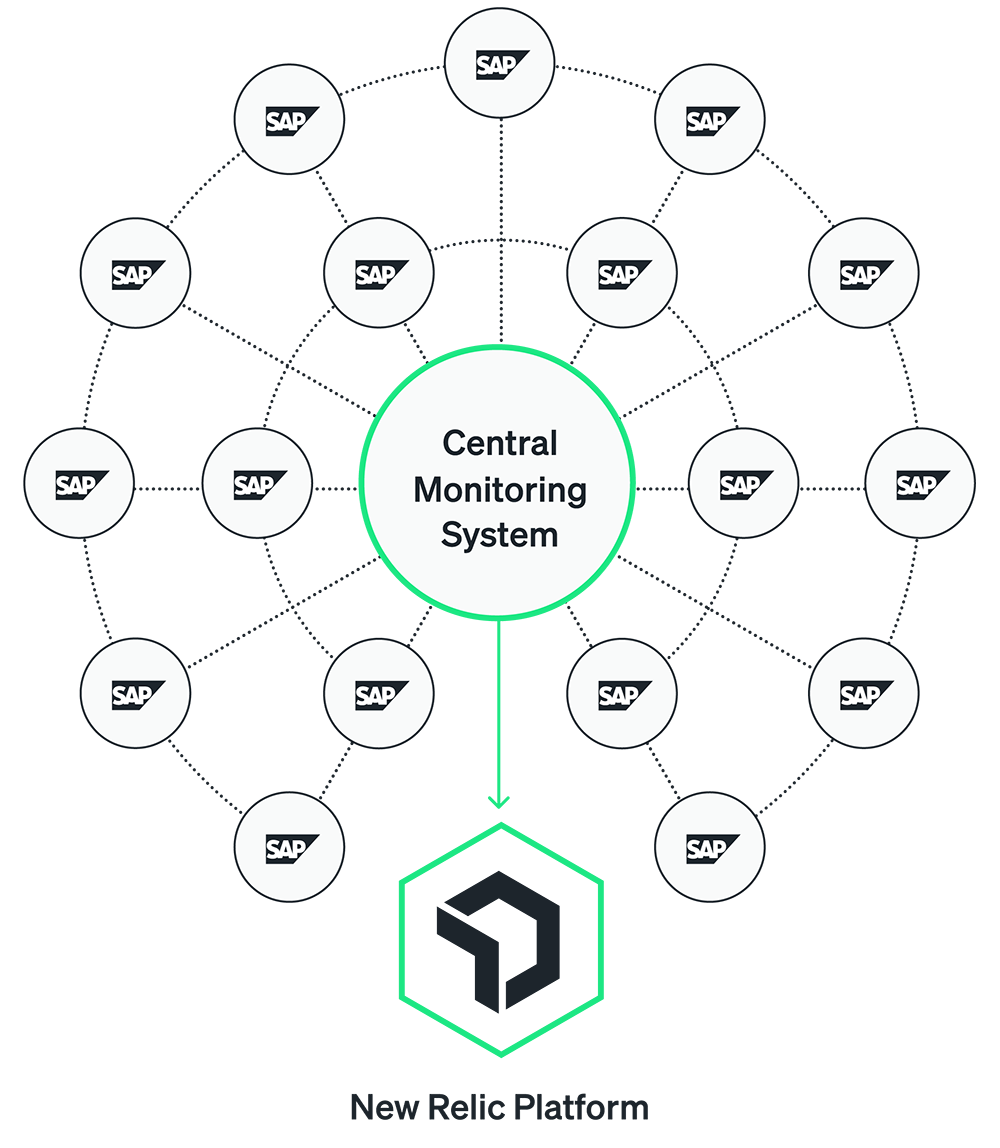
All in one SAP observability for all.
Bye, multiple monitoring tools. Hello, observability for all.
By integrating telemetry data from all your systems into one New Relic platform, you can monitor the performance and overall health of your entire SAP ecosystem or individual components instantly.
Power-up visualizations quickly and easily.
New Relic provides out-of-the-box visualization tools that can be tailored to your needs, for everything from dashboards, entities, workloads, and traces, to anomaly detection and alerts.
End-to-end ERP monitoring. One centralized view.
See all your entire ecosystem in a single view, so you can detect and fix issues at any point in your business process—before they impact on your bottom line.
Monitoring that fits your business processes.
New Relic contextualizes our monitoring based on your organization's business process, to make it easier for IT to better understand the business context—and meet their SLAs.
Keep SAP processes flowing.
New Relic IDOC Explorer for SAP gives you an instant visualization of IDOC flows and presents the errors with relevant information in context, so you can resolve those errors without missing a beat.
Get to root causes fast.
With system-wide automatic insights such as distributed traces you can quickly see why each open issue occured, which deployments contributed, what the relevant error logs and attributes are, and the probable cause to find the “why” of a problem as soon as it happens.
Forget unnecessary false alerts.
Get Dynamic Baseline alerts right out of the box with New Relic’s alerts package. Now your alerts will automatically adjust to accommodate any unexpected flow changes or business volatility.

SAP-friendly architecture makes onboarding easy.
With New Relic there’s no need to install monitoring agents in SAP production servers. You can leverage SAP existing data sources through an enterprise connector in a central monitoring server.