Send your data from everywhere
With our programmable platform you can ingest any text-based data, or data that can be converted to text from both on-prem or the cloud. Simply use New Relic’s log forwarder, or choose from our variety of third-party and open-source tools, including Fluent bit, Fluentd, Amazon Kinesis Firehose, Logstash, and more. You can even go agentless by easily forwarding syslog data to our TCP endpoint.
Leverage the Power of a central Telemetry Data Platform
Customers leveraging New Relic for Log Management have the full power of the Telemetry Data Platform - a platform born and built in the cloud as a central location for all your Telemetry data. All data is stored in NRDB, a scalable time-series database for metrics, events, logs, and traces. The open programmable platform ensures you can not only leverage the native built-in functionality but also integrate with third party and open source technologies to fit within your organization’s unique needs both for onboarding data, visualization, and for building custom applications to extend functionality.
Analysis at scale
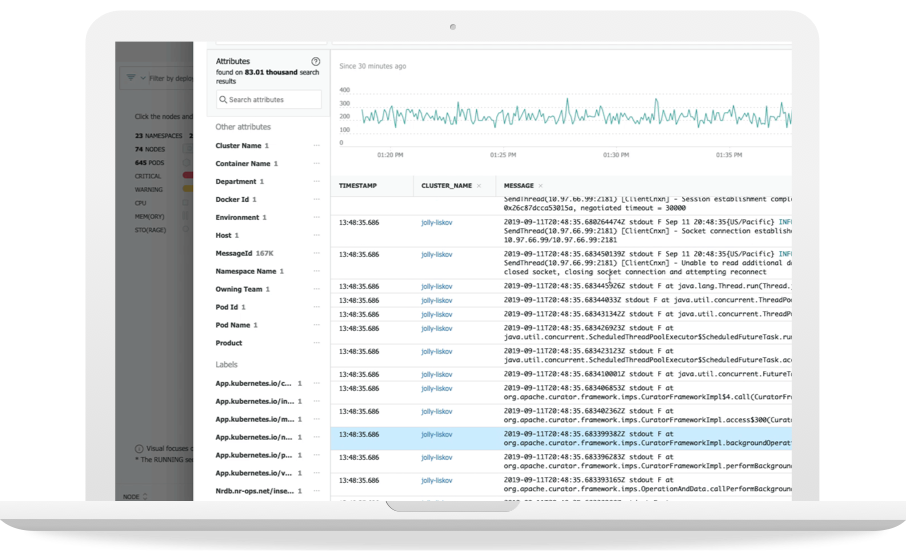
Now you can group logs driven by machine-learning patterns to automatically surface outliers and speed troubleshooting. The Telemetry Data Platform’s log management UI makes search simple. You can use widely known Lucene-based syntax, or automatically drop into NRQL language that’s purpose-built for NRDB. Search by time, filter to focus on areas of interest, pivot to show surrounding logs, save searches, and more.
The excel-like interface enables easy table view manipulation with the ability to show or hide attributes as-needed while the time-series chart can be faceted by attribute and provides the ability to easily zoom to focus on unusual spikes. Streaming real-time messages can be toggled on and off using a single click with Live tail.
Alerting and Dashboards are easy to configure for automatic notification directly in New Relic or through common platforms like Slack and PagerDuty. Dashboard development uses a simple drag and drop interface with the ability to see and extend the automatically-created underlying NRQL and supports features like monitor view and dark mode to ensure content is displayed in the way that fits each organization’s unique needs. The open programmable platform means users can also choose to leverage open source visualization tools like Grafana. To learn more about leveraging New Relic for log management, visit our documentation for setup, configuration, and best practices.
Full Stack Observability with Logs in Context
Beyond the Telemetry Data Platform, users of Full Stack Observability can have their logs automatically correlated to curated content across their full stack. APM errors, distributed tracing, and infrastructure dashboards for important sources like Kubernetes clusters. Leverage logs in Context where a trace and span ID is automatically applied to Full Stack Observability content ensuring faster mean time to resolution with more granular visibility into the underlying correlated logs. Our open platform enables you to develop in the language that works best for you, so we support Logs in Context for Go, Java, .Net, node.js, PHP, Ruby, and more.
Applied Intelligence
Customers leveraging logs with Applied Intelligence have the added benefit of machine learning designed to reduce alert fatigue and notify about anomalous behavior so proactive action can be taken.
Logs in context without context shifting
Try New Relic Logs and get deeper visibility, near-instant search, and full contextual log information. With complete observability of your application and infrastructure performance data, you can easily correlate with your logs and resolve production incidents fast.
