Introduction
Modern software practices and cloud native technologies help teams ship software faster, more frequently, and with greater reliability. Unfortunately, modern teams now have more to monitor and react to—a wider surface area, rapidly evolving software, more operational data emitted across fragmented tools, and more alerts. There is more pressure than ever to find and fix incidents as quickly as possible—and prevent them from occurring again.
For many on-call teams, it still takes too much time to detect potential problems before they turn into incidents. Teams often work reactively, firefighting incidents while never finding time to implement processes that allow them to identify issues before they cause outages. With so many alerts, it’s increasingly hard to separate signals from noise, making response fatigue all too common.
Every minute that DevOps, site reliability engineering (SRE), and operations teams spend interpreting their telemetry data to detect anomalies, or manually correlating, diagnosing, and responding to incidents, is a minute that negatively impacts their service-level objectives (SLOs), their companies’ reputations, and their teams’ bottom lines.
The Rise of AIOps
By putting machine learning and artificial intelligence in the hands of DevOps and SRE teams, Artificial Intelligence for IT Operations (AIOps) technology helps them combat these issues. With a strong AIOps practice in place, teams can analyze and take action on their data to more quickly detect, diagnose, and resolve incidents impacting their systems.
When teams adopt AIOps technology, they gain the advantage of:
-
Proactive anomaly detection that raises issues before they hit production or impact customer experience and SLOs
-
Incident correlation that prioritizes alerts, reduces noise, and focuses on the issues that matter most, by correlating related incidents and enriching them with metadata and context
-
Intelligent alerting and escalation that automatically route incidents to the individuals or teams who are best equipped to respond to them
- Automated incident remediation to better diagnose and resolve incidents and reduce mean time to resolution (MTTR)
Improving the Incident Response Life Cycle: A Three-Step Framework for AIOps Best Practices
The incident response life cycle can vary from organization to organization, and even from team to team, but a typical cycle consists of three steps:
-
Detect the incident through proactive monitoring and alerting
-
Understand where the incident is coming from and its potential impact
-
Resolve incidents and improve the process for how you detect and respond to future incidents
For DevOps teams, SRE teams, and on-call teams, New Relic AI is an AIOps solution to help manage and scale incident response cycles.
At New Relic AI’s core is a powerful, flexible, hybrid machine learning engine that reduces alert noise, correlates incidents, and automatically detects anomalies. It learns from your data and feedback over time to deliver smarter incident context. To ensure you can continue to use the notification and collaboration tools already in place, New Relic AI integrates with your existing tools. This includes PagerDuty, New Relic Alerts violations, and others, with critical insights delivered to your Slack channels, including intelligent incident context and automatic anomaly detection.
New Relic AI is available as part of the New Relic One platform.
New Relic AI comprises two essential capabilities:
-
Proactive Detection provides insights about anomalies in your production system. Real-time failure warnings alert you when an anomaly is detected, and notifications are sent directly in your Slack channel where your teammates can see them.
-
Incident Intelligence provides an overview of all your incidents, their sources, and related events. Incident Intelligence learns from your data and your team’s feedback to intelligently suppress alerts you don’t care about and correlate related incidents.
In this guide, you’ll learn how to use New Relic AI and AIOps best practices to enhance the three-step incident response cycle. The full process includes:
- Step 1: Improve your detection capabilities
- Step 2: Diagnose and understand issues
- Step 3: Resolve incidents and improve your response process
Step 1: Improve Your Detection Capabilities
The first step in your incident response cycle is detecting new issues when—or before—they occur. With traditional DevOps tools and processes, configuring your system to reliably detect issues can involve hours of configuration and require your teams to have specific knowledge about your production infrastructure and applications, as well as your chosen monitoring and alerting tools. When you do have monitoring systems in place, they’re often noisy, making it difficult to detect real problems among a collection of irrelevant, low-priority, flapping, or duplicated alerts.
To improve your detection capabilities, you need to:
-
Automatically detect anomalies that may not be captured by preconfigured monitoring systems.
-
Streamline the integration process to easily connect all your data sources for alerts, events, and incidents.
-
Correlate related alerts and events to reduce noise and increase the probability that critical signals don’t go unnoticed.
Let’s look at how you can achieve each of these with New Relic AI.
Automatically surface anomalies
Configuring data sources and decisions for issues that you anticipate is a critical step to quickly detecting problems in your services and applications. However, some of the worst production incidents can be caused by issues you don’t anticipate.
Proactive Detection in New Relic AI uses the following workflow to detect anomalies in your application data:
-
Proactive Detection monitors metric data reported by New Relic APM agents monitoring your applications, and builds a model of your applications’ dynamics, focusing on throughput, response time, and errors.
-
If one of these signals shows anomalous behavior, the system flags it and tracks recovery to normal behavior.
-
The system adapts to changes in your data, and continuously updates models based on new data.
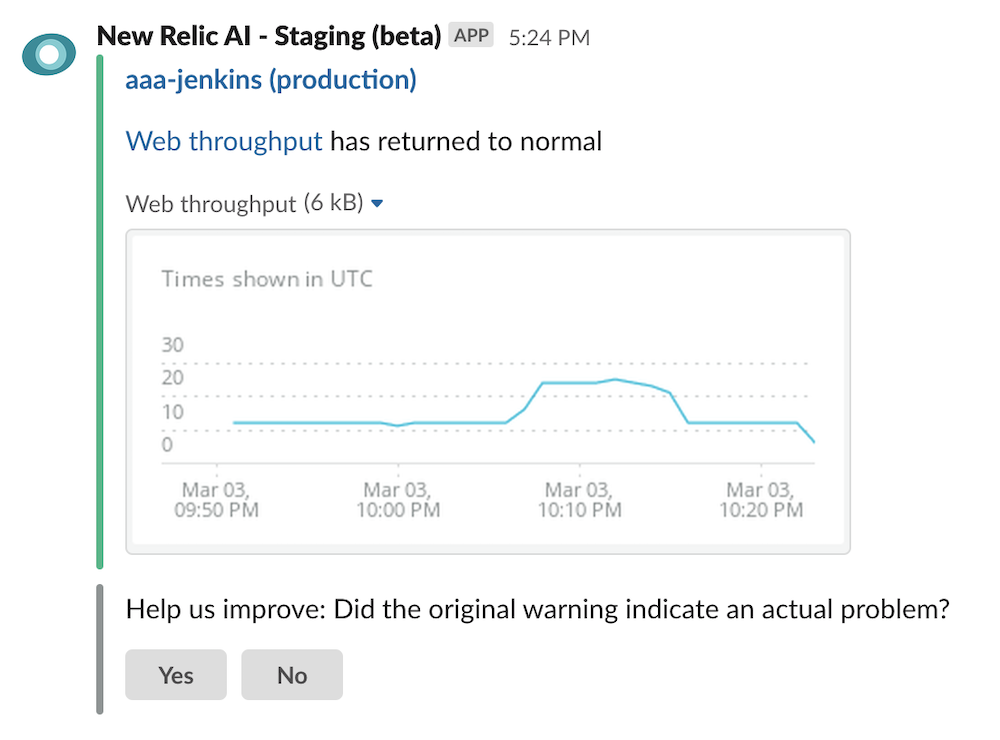
With New Relic AI’s Proactive Detection, you can configure real-time failure notifications to be delivered in Slack or your preferred notification channels via webhook. Each notification is a response to an anomaly condition detected with respect to throughput, response time, or errors, and includes information about the anomaly, such as a graph of the recent trend and the related target, condition, and policy.
See Configure Proactive Detection for Slack for specific instructions on having notifications delivered to Slack.
Streamline the integration process
New Relic AI provides a simple integration flow for getting incident data from popular sources, such as PagerDuty. The Incident Intelligence data pipeline includes sources (from where you want to ingest incident and alert data), destinations (where you want to send correlated incidents), and pathways (configurable logic to direct incoming incidents to the correct destination). Once configured to do so, Incident Intelligence can ingest, process, correlate, and enhance your incidents.
For example, to get data from PagerDuty:
-
Make sure your PagerDuty API key has write access.
-
Go to one.newrelic.com > New Relic AI > Incident Intelligence > Sources > PagerDuty.
-
Enter your PagerDuty API key. This should be either a personal or general access API key with write access; if it's user-created, the user should be an admin.
-
Select the PagerDuty services you want to connect to New Relic AI, and click Connect.
You can also integrate data inputs from many tools and platforms you likely use, including Prometheus Alertmanager, Splunk, Grafana, Amazon Web Services (AWS), as well as virtually any additional incident management tool or source of alert data via the New Relic AI REST API. As soon as you configure these sources, new incidents and issues will begin to appear in New Relic AI (and can be forwarded to your configured destinations according to any additional pathway logic you configure).
The differences between sources, destinations, and pathways
-
Sources are the data inputs to New Relic AI. Available sources include PagerDuty services, New Relic Alerts violations, alerts and events from Splunk, Prometheus, Grafana and Amazon CloudWatch, as well as virtually any other source via a flexible REST API.
-
Destinations are the data outputs that will receive streamlined, correlated, enhanced incidents after they’re processed in New Relic AI.
-
Pathways are the logical routes from enhanced incidents to specific destinations. For example, you could specify that all incidents with application/name containing foo go to the Foo team’s dedicated PagerDuty service.
Correlate related alerts and events to reduce noise
It's not uncommon for teams to configure a broad, comprehensive monitoring system and then find themselves overloaded by noisy notifications. Their system may have legitimate problems, but it can be difficult to discern real alerts from streams of low-priority, irrelevant, flapping, and duplicate alerts. Responding to noisy notifications—if even to simply acknowledge them—can lead your on-call teams to experience alert fatigue, which can make them less likely to notice, or have time for, real issues. AIOps tools reduce alert noise through multiple levels of intelligent filters so that on-call SREs and DevOps teams are notified about only important issues.
Filter the noise
To reduce incident noise, New Relic AI provides a configurable set of filters in the System settings tab. Here, you can specify a grace period for each issue priority, which tells the system how long to wait before surfacing a new incident. During this time, New Relic AI will evaluate if the incident is correlated with other incoming incidents, if it’s flapping, or if it’s auto-resolving. You can also configure an option to auto-close inactive issues.
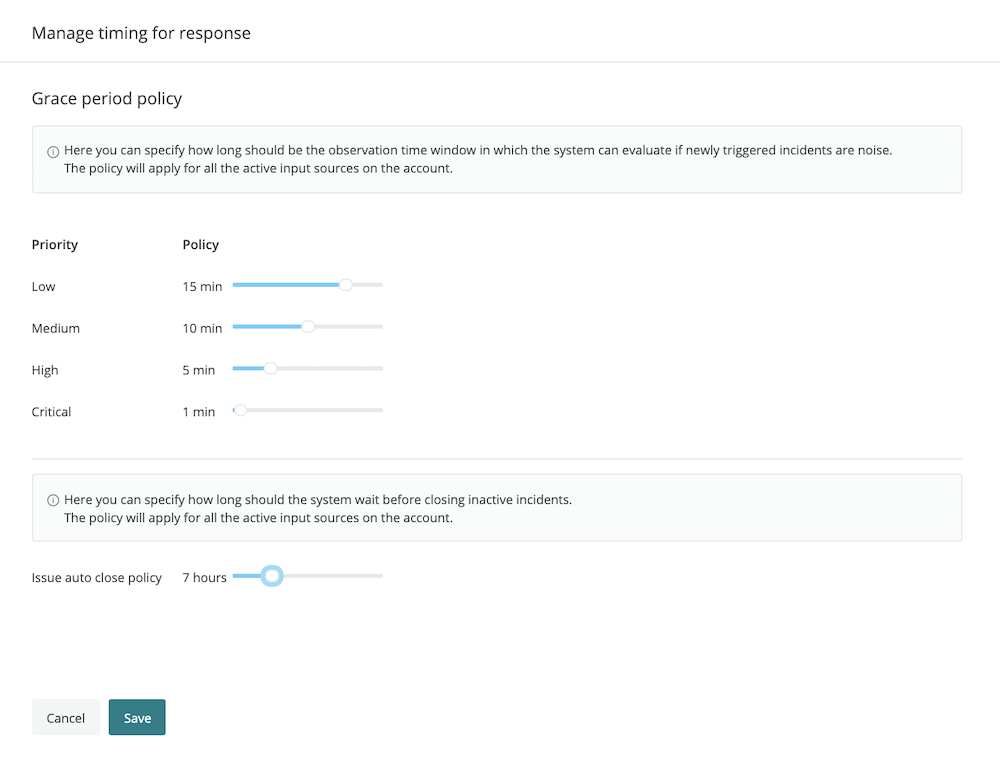
Use the Systems settings to set filters for evaluating incident noise.
New Relic AI automatically determines issue priorities using a combination of factors, including normalized priority data from the incident source (if available). You can also configure decision logic to change an issue’s priority dynamically when it’s correlated with other issues, using decisions.
Correlate issues to reduce noise
As issues arise in your system, New Relic AI continuously evaluates them and merges any issues that should be correlated. In addition to providing enhanced context and means to faster troubleshooting, issue correlation is a key tool for reducing incident noise.
New Relic AI’s correlation engine includes several types of rule sets, called decisions:
-
Global decisions: Created by New Relic AI, these decisions are applicable to many different production environments.
-
Baseline decisions: Created by New Relic AI, these decisions are created automatically for your environment.
-
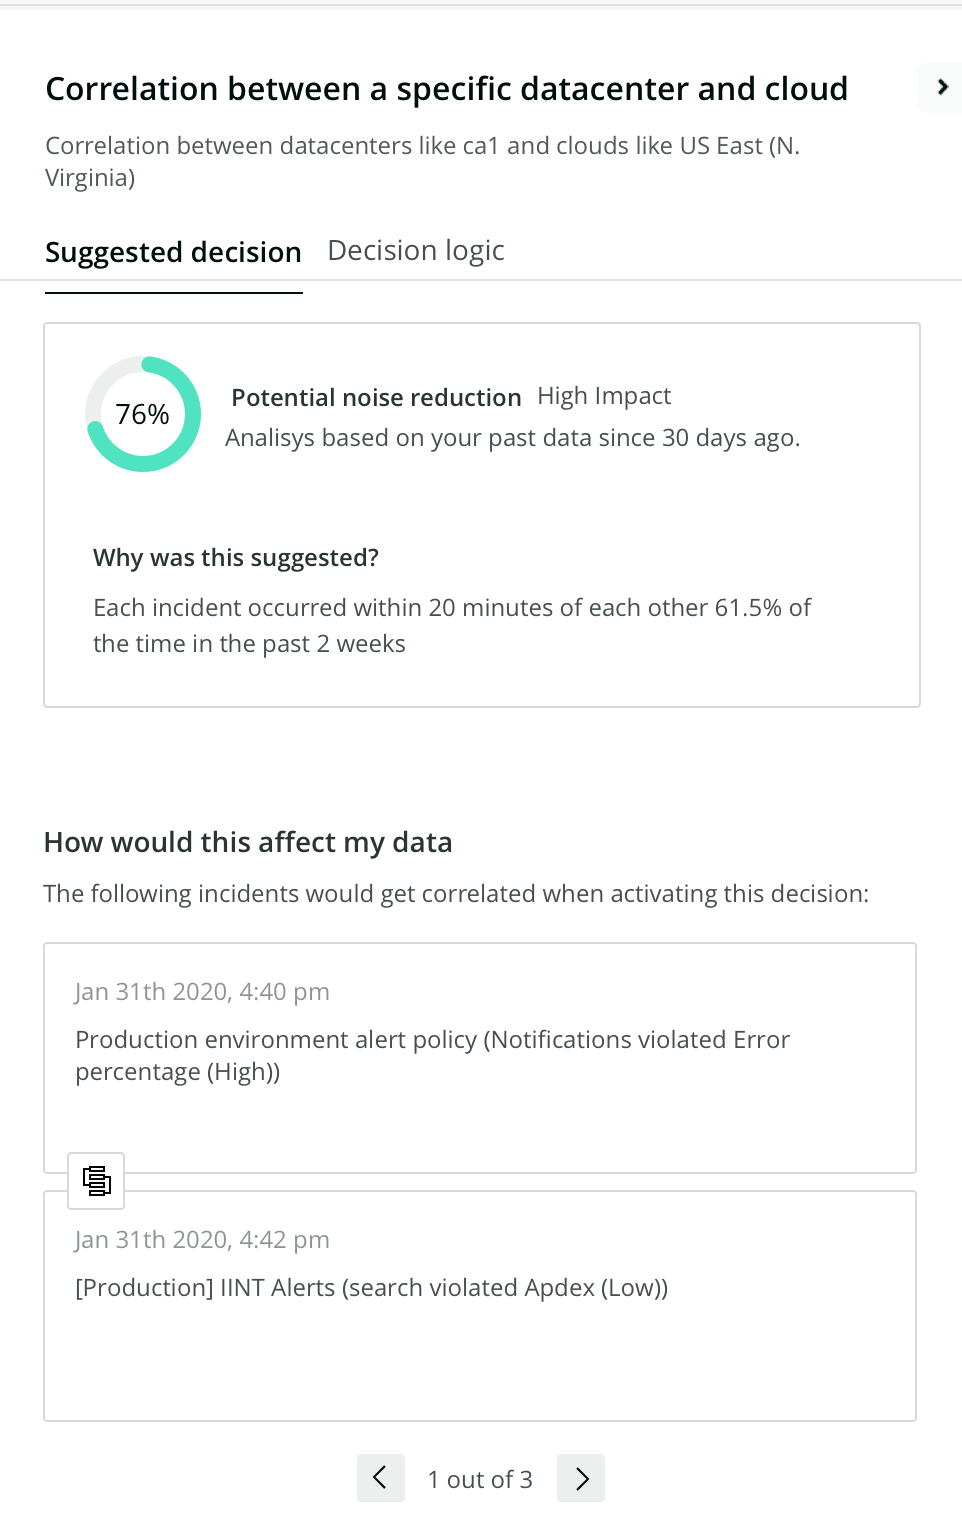
Suggested decisions: Created by New Relic AI, based on analysis of your data, these decisions require your review and approval to become active.
-
Manually created decisions: These decisions require configuration by your team.
For example, to create a decision to reduce noise in your environment
1. Go to one.newrelic.com > New Relic AI > Incident Intelligence > Decisions > Add a decision.
2. Specify which incidents to consider for correlation. In this case, let’s examine all incidents from New Relic Alerts and AWS.
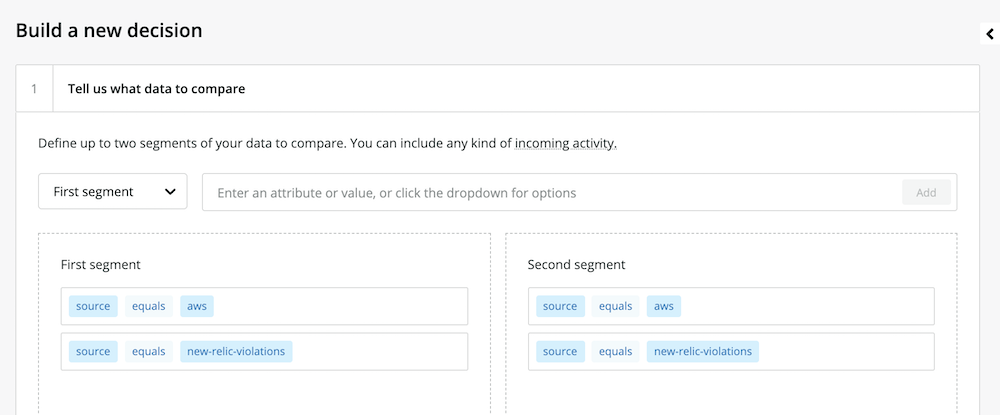
The New Relic AI decision builder
The decision builder can use any attribute of your data for comparison, and the decision builder will automatically add any new attributes. For example, you can compare incidents that have only a specific class or priority, or you can compare incidents with descriptions that include certain keywords. You can also add any other custom logic to compare incidents.
3. Add logic to specify the conditions for correlating incidents. For this example, we want to correlate incidents with the sources we’ve specified (New Relic Alerts and AWS), if they have similar hostnames and the same underlying symptoms.
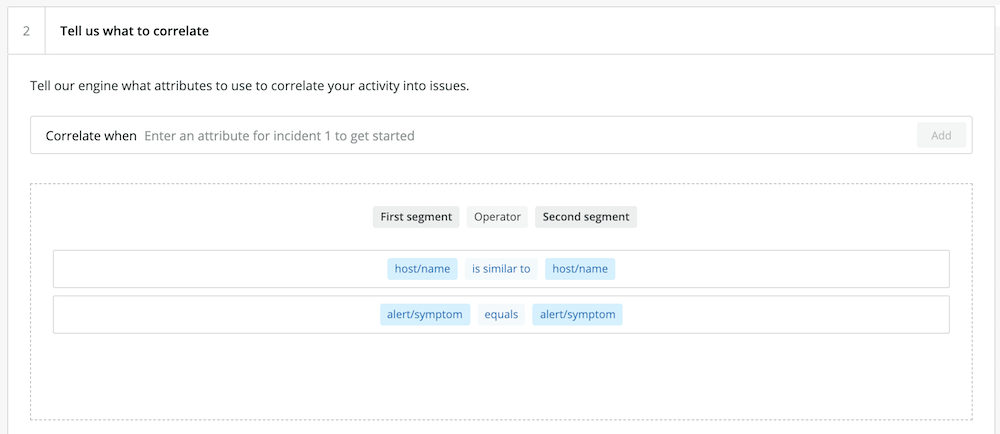
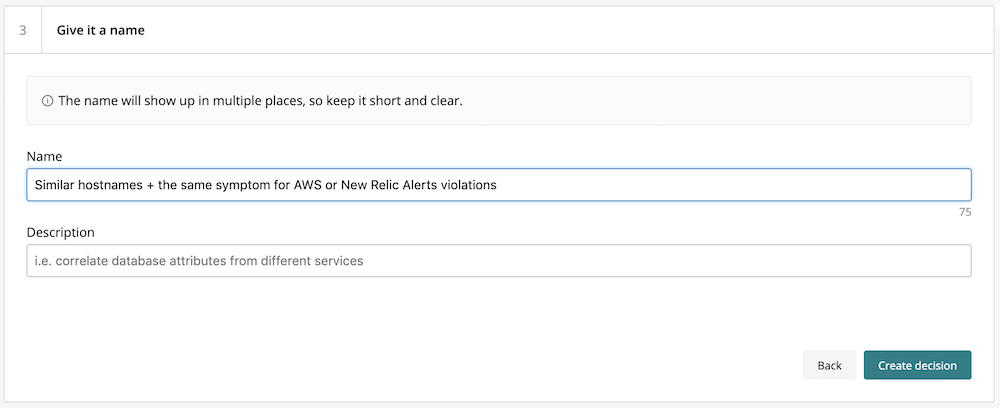
4. Create a human-readable name for the decision logic specified in step 3.
5. In the Advanced settings tab, configure the correlation logic as needed. For example, we can modify the default settings to correlate issues if they occur within 30 minutes of one another, but only if there are at least three issues that meet the specified conditions.
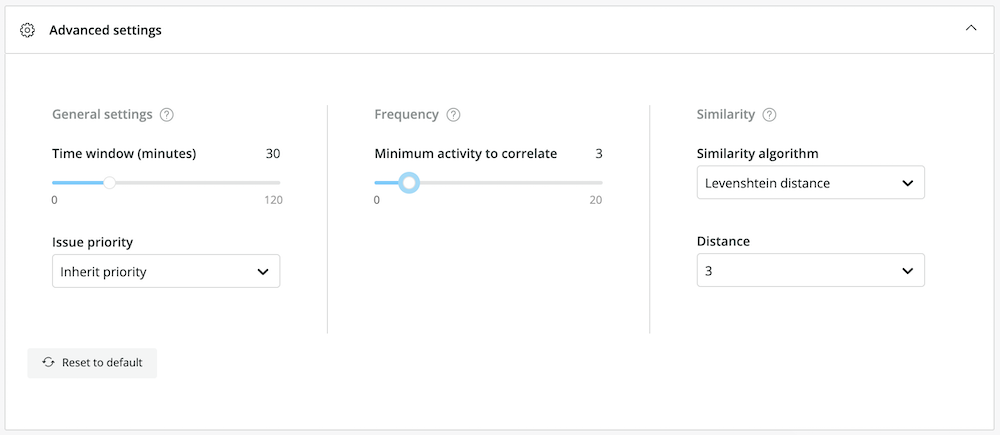
TIP: The default similarity algorithm, Levenshtein distance, is a good choice for comparing hostnames. (Hover over each algorithm in the drop-down menu to learn more about it.)
6. To activate the new rule set, click Create decision. You’ll be able to see how many issues are correlated with this logic over time in the main decisions view.
Configuring decisions based on your previous experience with your environment, and enabling the decisions that New Relic AI automatically suggests based on trends in your production data, can help dramatically reduce noise and ensure that New Relic AI quickly surfaces real and urgent problems.
After you configure New Relic AI systems to collect, organize, and filter your data—for both anticipated and unforeseen problems—you can have confidence in your ability to quickly and reliably detect important issues. The next step in the incident response cycle, then, is to diagnose and understand the problems that do occur.
Step 2: Diagnose and Understand Issues
After an on-call SRE or DevOps engineer receives a notification, they need to determine the underlying cause of the issue and take actions to resolve it. Sometimes, the cause of an incident is obvious and the diagnostic process is straightforward. Unfortunately, the majority of incidents will require some investigation and troubleshooting. AIOps tools, such as New Relic AI, give on-call team members a better chance of diagnosing and understanding issues faster.
To more accurately diagnose and understand issues, you need to:
-
Surface key details and streamline information to prevent problems from escalating.
-
Dig deeper into issues to learn about affected components, potential impact, and any related issues.
- See the broader context to understand the full impact of an issue.
Surface key details and streamline information
Now that you have some intelligent detection tools and techniques in place, you have a better chance of discovering problems before they get out of control. However, if you hope to stop problems from escalating or impacting your customers, the first moments after detection are critical. By streamlining the information presented for each new issue and surfacing details that must be understood quickly, New Relic AI helps your first responders in these crucial moments.
For each issue it uncovers, New Relic AI creates an issue card and populates it with the following details:
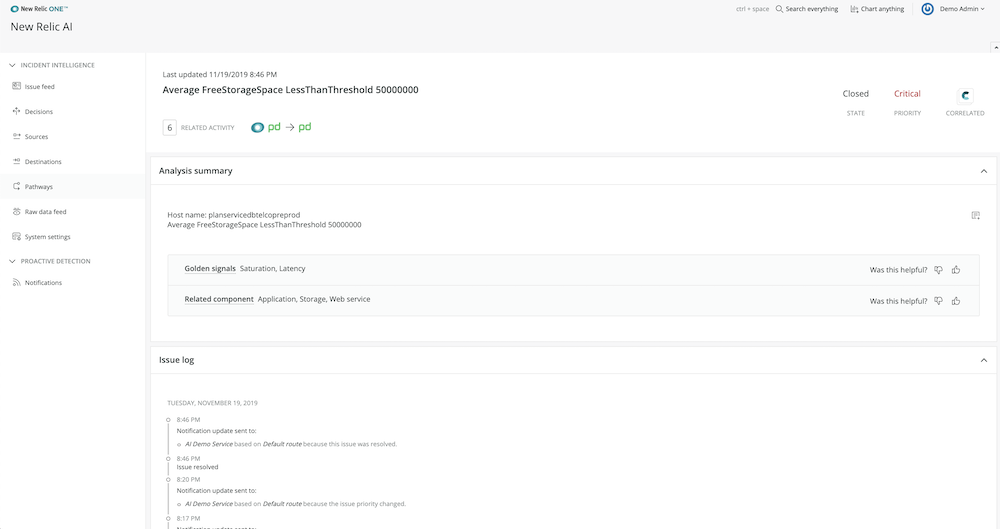
New Relic AI issue cards surface critical information to help you more quickly respond to incidents.
-
An intelligent (human-readable) issue title. The names and descriptions of new incidents don’t always explain the issue in intuitive ways (especially to new team members, who may have limited experience with the systems they’re helping troubleshoot). New Relic AI uses natural language processing to create a more readable title for each issue based on keywords in incident payloads.
-
An analysis summary. New Relic AI’s machine learning engine automatically classifies each issue according to throughput, response time, and error measurements, then provides suggestions for components or services that may be related to the underlying problem.
- Correlated issues and decision descriptions. If issues are correlated, New Relic AI will provide details in the parent issue card of each correlated issue and the reason (the decision name and description) for each correlation. This allows you to understand, at a glance, other services or components that may be impacted and the underlying logic correlating the issues.
Dig deeper into issues
After glancing through the issue details to understand high-level information about a problem—e.g., affected components, potential impact, and related issues—you’ll likely perform more diagnostic steps before you fully understand the issue’s root cause.
Here are five ways to perform deeper investigation into an issue:
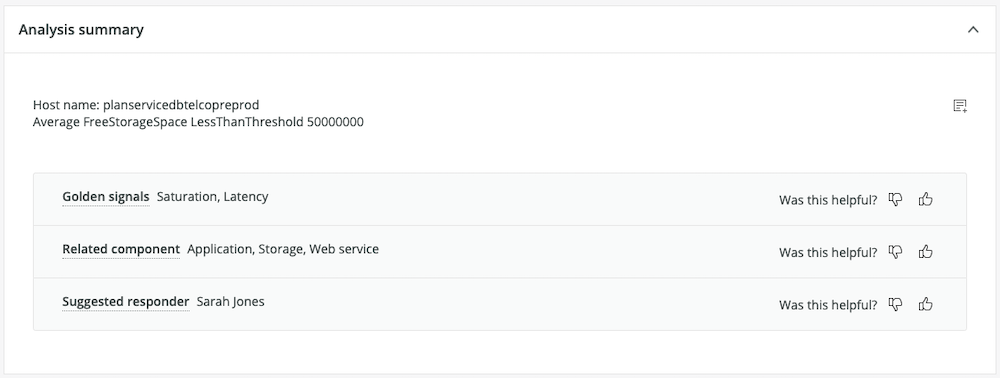
1. In the Analysis summary, New Relic AI provides valuable metadata and contextual enrichment to help you diagnose incidents faster. It automatically classifies your incidents to tell you if they’re related to throughput, response time, or error issues, to help determine the probable causes of problems. Next, New Relic AI tells you which components in your environment are affected by an issue, so you can figure out where the issue occurs and more quickly isolate it. Finally, New Relic AI tells you who on your team is best equipped to respond to the problem and suggests responders to whom you should route incidents.
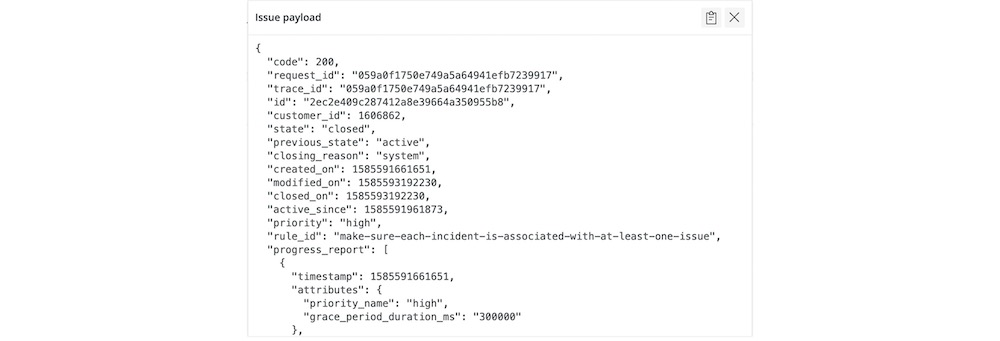
2. For each issue’s analysis summary, use the full issue payload to get details such as the issue’s progress over time, including new events for the same incident, as well as newly correlated incidents.
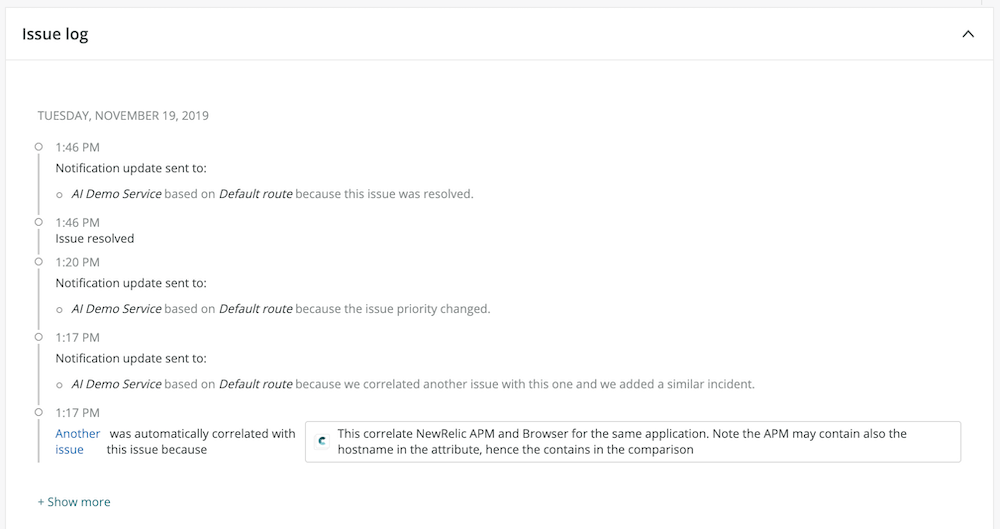
3. To quickly understand the progress of and changes to each issue since its creation—which can be particularly helpful for issues that are escalating or impacting other services—use the issue log, which describes each significant event to occur for the issue, including its activation and resolution, correlation, and any notifications associated with it.
From the issue log, you can also navigate to the details card for correlated issues. Follow the Another Issue link to see the description lines for correlated events.
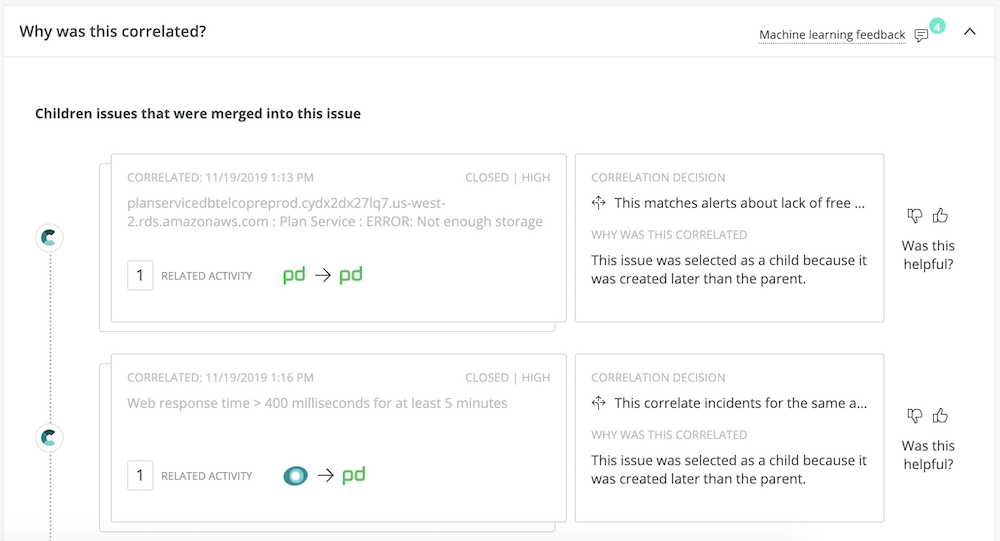
4. If an issue was merged with others, you can find more detail about the correlated issues and decision logic in the issue card. Select the Correlation Decision description to see the specific rule logic that governed the correlation, which can be helpful for gaining greater insight into the problem as a whole. For example, if a decision involves comparing application names for similarity, you know that a specific application or application group may be affected by a particular issue.
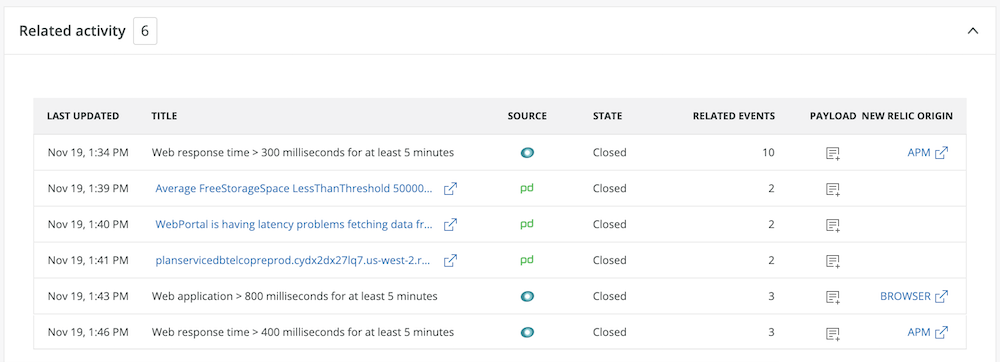
5. Use the Related activity section to get information about previous issues that may have a similar cause or affected components/services to the issue you’re currently troubleshooting. Compared with correlated issues, which are current and related to the immediate underlying cause of the open issue, Related activity gives you clues about historical issues that you may be able to learn from. Click into the issue payload for related activity from the current issue details to see more information.
See the broader context
Having insight into open issues and understanding where issues are directly related (correlated) or similar based on historical data (related activity) is critical in the diagnosis phase of the incident response cycle. However, you may need to take a broader look at issues to understand their impact on your production system. New Relic AI gives you multiple tools to see that broader context.
Proactive Detection provides information about the historical data surrounding an anomaly event in Slack, so you can quickly understand context without having to switch tools. From there, you have several options for seeing more information about the anomaly:
-
Click View Incident to go directly to the incident details in New Relic AI.
-
Click Go to Runbook for information about incident resolution.
- Click Application Overview for details about the application experiencing an anomaly.
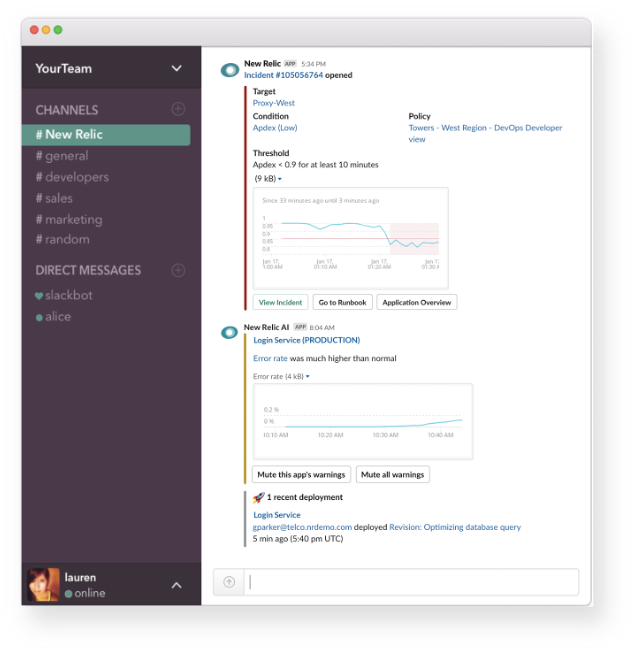
Get information about the historical data surrounding an anomaly event in Slack.
New Relic can also help enrich New Relic Alerts webhooks with broader context by stitching information from other sources (NRDB, for example) into the webhook payload.
You can access this functionality—including integrating with additional notification sources and enriching incidents with the output of New Relic Query Language (NRQL) queries—by modifying the custom payload of a New Relic webhook.
Here are a few ways to do this:
Execute NRQL queries and add their output to the webhook.
In the example below, adding a field to the webhook payload definition will stitch the NRDB output (the details of a transaction for the erroring application) into the final payload. Notice the use of {{template_text}}; other fields from the webhook payload can then be mapped into the query string.
“nrql_execution”: “SELECT * FROM Transaction WHERE appName = {{application_1}}”
Map attributes from the webhook to make the output easier to parse in your end destination.
Here, the owner field specified in the default webhook payload is mapped into a new field called service_owner, and a new priority field is defined with a static value:
“map_attributes”: {
        “service_owner”: “{{owner}}”,
        “priority”: “2”
      }
Send New Relic webhooks to new destinations.
In this example, we add awseventbridge as a notification channel for new webhooks to be directed to:
“notification_channels”:[
   {
      “type”: “awseventbridge”,
      “endpoint”: “<your eventbridge endpoint>”
   }
]
See the documentation for more information.
Armed with intelligent tools for quickly understanding the main aspects of the problem, easily exploring more detailed issue information, and seeing the broader context surrounding production incidents, on-call SREs will be able to achieve faster MTTR.
Step 3: Resolve Incidents and Improve Your Response Process
The final step of the incident response cycle is the response itself. As we’ve seen, AIOps tools can enable faster detection and diagnosis of production issues, which in turn leads to faster incident response. New Relic AI can help accelerate your response in four important ways:
-
Deliver insights to the tools you already use without changing your existing workflow.
-
Direct issues to the right people who are best equipped to resolve them.
-
Provide feedback for continuous improvement, so New Relic AI can make smarter recommendations in the future.
- Automatically trigger remediation actions to proactively detect and fix problems with as little human involvement as possible.
Deliver insights to the tools you already use
If your DevOps and SRE teams use a variety of tools to monitor their systems and incident responses, that incident data can become fragmented, requiring more steps and more tool-specific knowledge to discover, acknowledge, and resolve issues. New Relic AI delivers incident information directly to the tools you already use so you can take advantage of the benefits of intelligent correlation, event enrichment, and anomaly detection without needing to change or add to your existing workflow.
Configure Proactive Detection for Slack
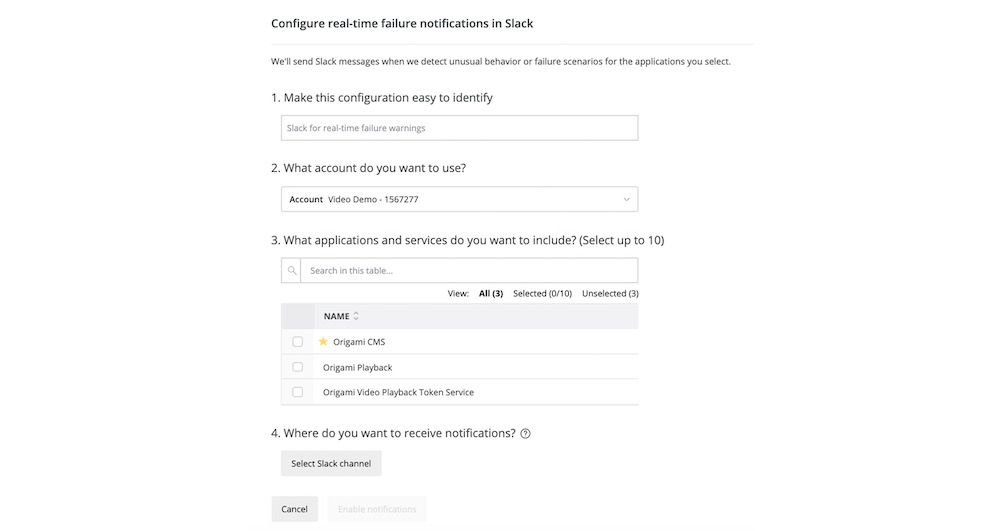
Proactive Detection integrates with Slack, but you can also configure anomaly events to be delivered via webhook.
To set up Proactive Detection for Slack:
-
Go to one.newrelic.com > New Relic AI > Proactive Detection > Notifications.
-
Select Real-time failure warnings in Slack. Then click Add configuration.
-
Input the following information into the form:
-
Select an account.
-
Select applications. Note that certain applications with low throughput might not be good candidates for Proactive Detection, as they can be more sensitive to smaller amounts of data fluctuation.
-
Choose which Slack channels receive notifications (you can send them to an existing channel or create a new one). This prompts the workflow to add the New Relic AI Slack application to your selected channel.
Tip: If you experience an error when assigning Slack channels, make sure that the New Relic AI Slack application has been added to your Slack workspace.
-
Choose a name for your configuration that helps you to easily distinguish it from others in your account.
-
Enable the configuration. You can modify the applications for each configuration at any time by selecting Edit configuration in the configuration table.
-
Configure PagerDuty as an Incident Intelligence destination
You can also integrate Incident Intelligence with your existing incident management tools, such as PagerDuty. In this case, PagerDuty is a destination—a data output to New Relic AI, where you can view your automatically correlated incidents.
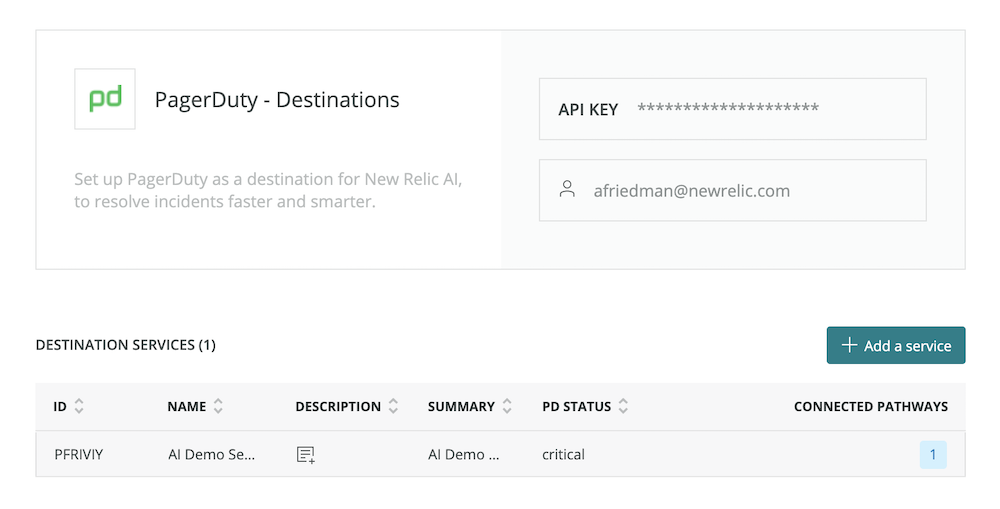
To configure the PagerDuty destination:
-
Go to one.newrelic.com > New Relic AI > Incident Intelligence > Destinations > PagerDuty.
-
Enter your PagerDuty API key. This should be either a personal or general access API key with write access; if it's created by a user, the user should be an admin. This can be the same API key used for the PagerDuty source (if you configured this source).
-
Select the PagerDuty services you want to connect to New Relic AI, and click Connect.
Getting data in the right tools is a critical step to accelerating incident resolution time. Instead of juggling multiple notification streams or learning new workflows, you can stay focused and keep using and improving the process your team has developed over time.
Direct issues to the right people
In addition to directing incident information to the correct tools, it’s important that you send issues to the people who can solve them. This is especially critical if you’ve adapted a hybrid organizational model for your incident response process, or if you’re transitioning from a traditional operations to a DevOps or SRE model. In New Relic AI, you can configure pathways for alerts, and, over time, New Relic AI will use historical incident data to suggest responders who may be able to help resolve an incident.
Pathways are the logical connections between sources (data inputs) and destinations (data outputs) in the Incident Intelligence system.
To configure a pathway:
-
Go to one.newrelic.com > New Relic AI > Incident Intelligence > Pathways, and select Add a pathway. Give your pathway a human-readable name.
-
In the query builder box, specify or select an attribute, such as
application/name. Select from the list that includes all the attributes available in PagerDuty incidents and New Relic Alert violations, or add your own attributes. -
Select a logical operator; for example,
contains. -
Enter a specific value to complete the logical expression.
-
To include all issues created by the sources you configured, select Send everything. (This is recommended if your team uses only one PagerDuty service to manage all incidents.)
-
To build more complex logic, use the
AND/ORoperators.
-
-
Select the destination (e.g., PagerDuty) you configured.
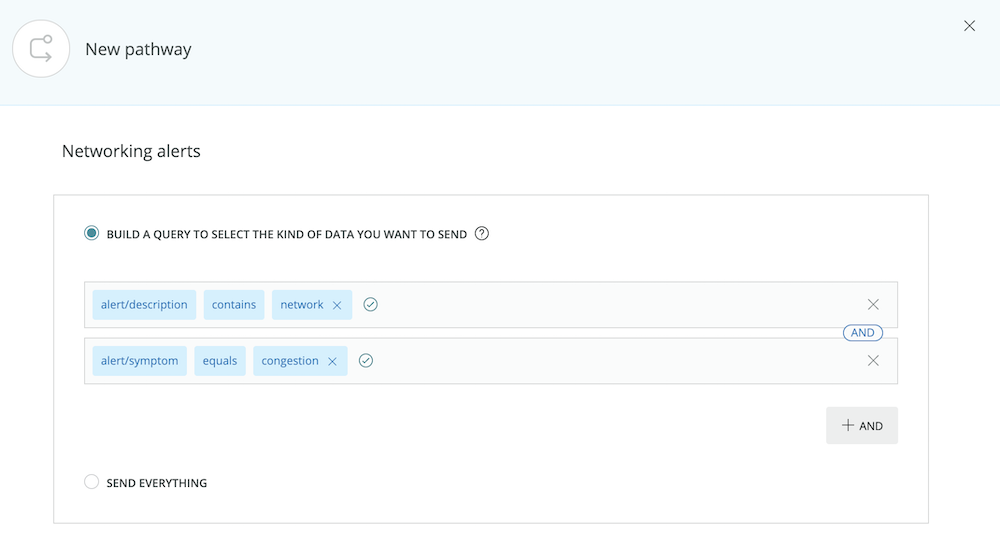
If the person who receives the incident needs extra help fixing the problem, New Relic AI provides a suggested responder (e.g., another team member) based on previous trends for who has responded to similar issues in the past. Like many aspects of New Relic AI, this functionality will get more accurate over time based on your interaction and feedback.
Provide feedback for continuous improvement
The more data New Relic AI collects, both from your production system and your team’s feedback, the smarter it will become—from the suggestions it makes for decisions to suggested responders and to anomaly events. Smarter recommendations will in turn enable faster incident resolution on your part. Some ways to give feedback to New Relic AI include:
-
Accepting or rejecting newly suggested decisions
-
Giving thumbs up/down feedback on correlated issues
-
Clicking “yes” or “no” under “Did the original warning indicate an actual problem?” in real-time failure warnings

Automatically trigger remediation actions
As AIOps technologies mature, you can expect more automation in the incident response cycle—for example, being able to proactively detect and fix problems without any human involvement. Although a pager-free reality is still a thing of the future, New Relic AI is able automatically trigger actions to remediate issues.
Here’s an example of how you can integrate with Amazon EventBridge to proactively prevent an issue with automation. Let’s say a service in your app is an AWS Lambda function that should never time out. Here’s how to integrate with EventBridge to prevent disruptions to your service functionality and uptime:
- Write a NRQL query to scan New Relic Logs for AWS Lambda functions timing out. For example:
Find logs where has:”aws.logGroup” “timed out” - Configure a webhook to send data into EventBridge. Include the NRQL query from Step 1 in the webhook payload definition.
- Write an AWS Lambda function to increase the timeout of a different function, using a placeholder Amazon Resource Name (ARN) to represent the function timing out. (Check out the AWS Lambda documentation for guidance.)
- Create an EventBridge rule, triggered by the New Relic webhook you configured in Step 2 and using the NRDB output included in its payload, to activate the Lambda function you wrote in Step 3. (See EventBridge resources for walkthroughs and examples.)
With this workflow, you will be able to prevent temporary issues from disrupting the uptime or functionality of your services that use AWS Lambda functions, without requiring an SRE or developer to make changes manually.
This is just one example. Imagine scaling applications automatically with increased demand, responding to infrastructure anomalies, and gathering more information based on custom events captured in New Relic. This use case, and more, are the future of AIOps.
Conclusion
Implementing an AIOps solution, such as New Relic AI, can help you tackle alert noise across your entire tech stack and create a continuously improving, streamlined system that enhances your incident response cycle. We believe it’s critical to embrace solutions that are easy to connect and configure, work with the tools that teams already use, create value throughout the entire observability process, and learn from data patterns and user feedback to get smarter over time.
When you’re able to resolve issues faster, you’ll be better prepared to focus on higher-value, creative work while decreasing stress and toil.
Now is the time to empower your busy DevOps and SRE teams with intelligence and automation. Get started with New Relic AI on the New Relic One platform today.
Ready to learn more about how AIOps? Check out our webinar, Accelerate Incident Response with AIOps.
A three-step framework for AIOps best practices
An explosion of tools has made it faster than ever to ship software more frequently and with greater reliability. But it also means a wider surface area to monitor, fragmented tools, and a lot more alerts.
Couple all that with increased uptime demands, and there’s more pressure than ever to find and fix incidents as quickly as possible—and prevent them from occurring again.
To do that, you need to change how you troubleshoot. And that’s where AIOps comes in.
Accelerate Incident Response with AIOps shows you how to build a strong AIOps practice so you can detect, diagnose, and resolve incidents faster.
You’ll learn:
- How to reduce alert noise and subsequent alert fatigue
- How to streamline information and surface critical details when issues arise
- How to reduce mean time to resolution (MTTR)
AIOps adds machine learning and artificial intelligence to your troubleshooting toolbox, making it easier and faster to build better software.
