In front of a packed room at AWS re:Invent in Las Vegas, New Relic Developer Advocate Clay Smith delved deep into a pair of key concepts for monitoring in the age of microservices and serverless computing: “observability” and “instrumentation.”
In his session, Clay talked about a wide variety of concepts, from understanding AWS Lambda performance to how New Relic customers are using Lambda in production.
I recommend watching Clay’s entire presentation—which includes a Lambda monitoring case study and a fascinating Q&A with Scripps Networks’ Marcus Irven covering a Lambda project recently launched into production—in the video below. This post focuses on his thoughtful explanations of the meaning and importance of observability and instrumentation.
Blinking lights on the mainframe
Let’s start with some historical context. Clay points out that back in 1967, monitoring meant people in lab coats looking at the blinking lights on an IBM System/360 mainframe. Debugging meant printing out the entire contents of memory. Things look different today—we have different monitoring requirements, and jeans and hoodies have replaced the lab coats—but you still need to know what’s happening in execution.
Specifically, as people move to microservices and serverless computing architectures, a lot of the assumptions and best practices and playbooks for monitoring workloads in serverless computing environments have to change. Fortunately, good data can help accelerate that process, so the ideas of observability and instrumentation come up a lot more when we talk about things like Lambda, container orchestration systems, and so on.

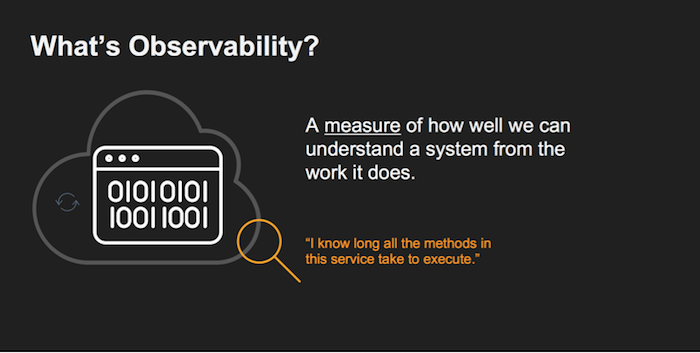
Observability, Clay says, is a measure of how well we can understand a system from the work it does, and how to make it better. It’s great for starting the conversation about “how well do you really understand what’s going on in these environments?”

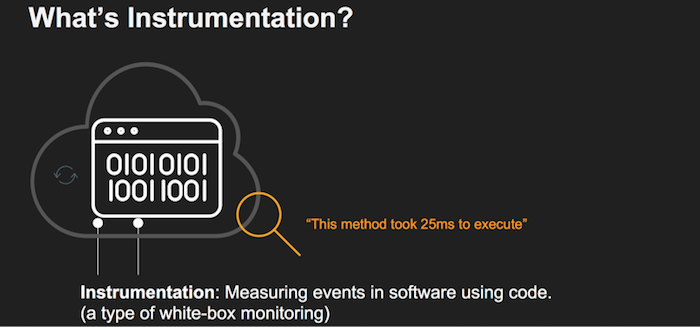
Related, and equally important, is the concept of instrumentation. This idea is all about what events do we want to measure in order to understand what the code is doing when it’s actually responding to an active request.
Observability, notes New Relic Software Engineer Beth Long, is a property of the system, and one over which you have at least some control. So instrumentation is a step toward increasing observability, but it’s not observability in itself. “You instrument and monitor a system as part of a broader strategy to make the system more observable,” she says.
How do we make microservices and serverless functions observable?
- Observable systems should emit events: metrics, logs, and traces.
- Each one has its uses, so you need a balance of all three.
- All components—not just critical services—should be instrumented.
- Full coverage of all components is required to tell the entire story.
- Instrumentation should not be opt-in, manual, or hard to do.
- Instrumentation should be built into everything you build and run.
- Dedicated observability teams can help make this a company-wide practice.
As noted above, this discussion touches on only a few of the topics addressed in the session. To get the whole story, watch the video and flip through the slide deck below:
The views expressed on this blog are those of the author and do not necessarily reflect the views of New Relic. Any solutions offered by the author are environment-specific and not part of the commercial solutions or support offered by New Relic. Please join us exclusively at the Explorers Hub (discuss.newrelic.com) for questions and support related to this blog post. This blog may contain links to content on third-party sites. By providing such links, New Relic does not adopt, guarantee, approve or endorse the information, views or products available on such sites.


