Observability Matters
Observability is gaining attention in the software world because of its effectiveness at enabling engineers to deliver excellent customer experiences with software, despite the complexity of the modern digital enterprise.
Observability is not a fancy synonym for monitoring. When software teams instrument their systems, they gain visibility into their data to respond quickly when errors and issues occur. Simply put, monitoring is building your systems to collect data, to know when something goes wrong and start your response quickly.
On the other hand, observability is the practice of instrumenting those systems with tools to gather actionable data that tells you not only when an error or issue occurs, but also why. The latter is what teams need to respond quickly and resolve emergencies in modern software.
Observability helps modern software teams:
- Deliver high-quality software at scale
- Build a sustainable culture of innovation
- Optimize investments in cloud and modern tools
- See the real-time performance of their digital business
Many teams adopt agile methodologies and development practices to accelerate business and customer value, which leads to increased velocity. The modern environments that support these teams have become easy to deploy, but highly complex and interdependent. Observability is extremely important for the future success of software teams and their organizations. It gives teams the ability to discover a connected view of all of their performance, business, and customer data in one place, in real time, to pinpoint issues faster, understand the root cause of the issue, and ultimately deliver excellent customer experiences.
What Is MELT?
Metrics, events, logs, and traces (or MELT) are the essential data types of observability required for a holistic understanding of a system’s operation. But observability is about much more than just data.
In the software lifecycle, observability encompasses the gathering, visualization, and analysis of metrics, events, logs, and traces in order to gain holistic understanding of a system’s operation.
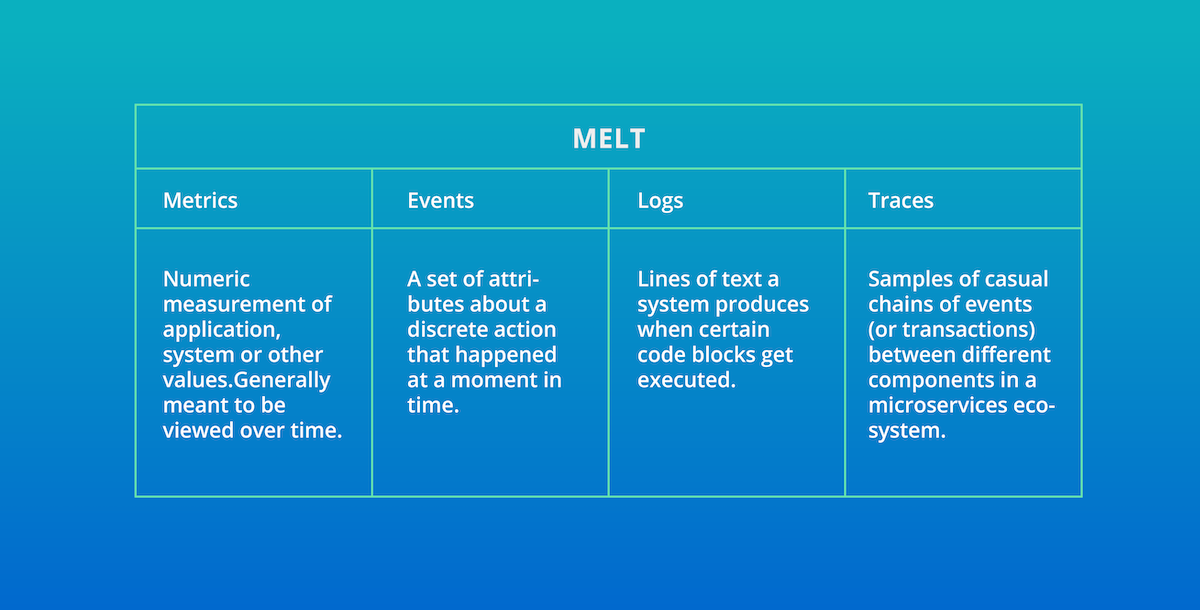
Metrics are a great starting point for observability. Metrics are inexpensive to collect and store, dimensional for quick analysis, and a great way to measure overall technical, business, and customer health.
Because of that, many open source tools have emerged for metric collection, such as Prometheus, Telegraf, StatsD, DropWizard, and Micrometer. Many companies have even built proprietary formats for metric collection on top of open time series-friendly datastores such as Elasticsearch. There are limitations with metrics in that they are aggregated over time and can lead to gaps in knowledge for specific events. An observability solution should be able to consume metrics from any source that diverse teams have adopted.
Events are a critical telemetry type that must be part of any observability solution. Unfortunately, though, events and logs share some similarities, and the two are often mistakenly conflated. Events are discrete, detailed records of significant points of analysis, but they contain a higher level of abstraction than the level of detail provided by logs. Logs are comprehensive and discrete records of everything that happened within a system; events are records of selected significant things that happened with metadata attached to the record to sharpen its context. For example, when New Relic collects transaction events—individual instances of the execution of a method or a code block in a process—data is automatically added to show the number of database calls executed and the duration of those calls. Events provide the ability to do fine-grained analysis in real time and help you answer questions beyond metrics.
Traces are valuable for showing the end-to-end latency of individual calls in a distributed architecture. These calls give specific insight into the myriad customer journeys through a system. Traces enable engineers to understand those journeys, find bottlenecks, and identify errors to fix and optimize.
Logs are essential when an engineer is in “deep” debugging mode, trying to understand a problem. Logs provide high-fidelity data and detailed context around an interaction in the system, so that engineers can re-create the flow of actions during a discrete period. Just as with metrics and traces, tools have emerged to reduce the toil and effort of collecting, filtering, and exporting logs. Common solutions include Fluentd, Fluent Bit, Logstash, and AWS CloudWatch, as well as many other emerging standards.
Successful Observability With New Relic
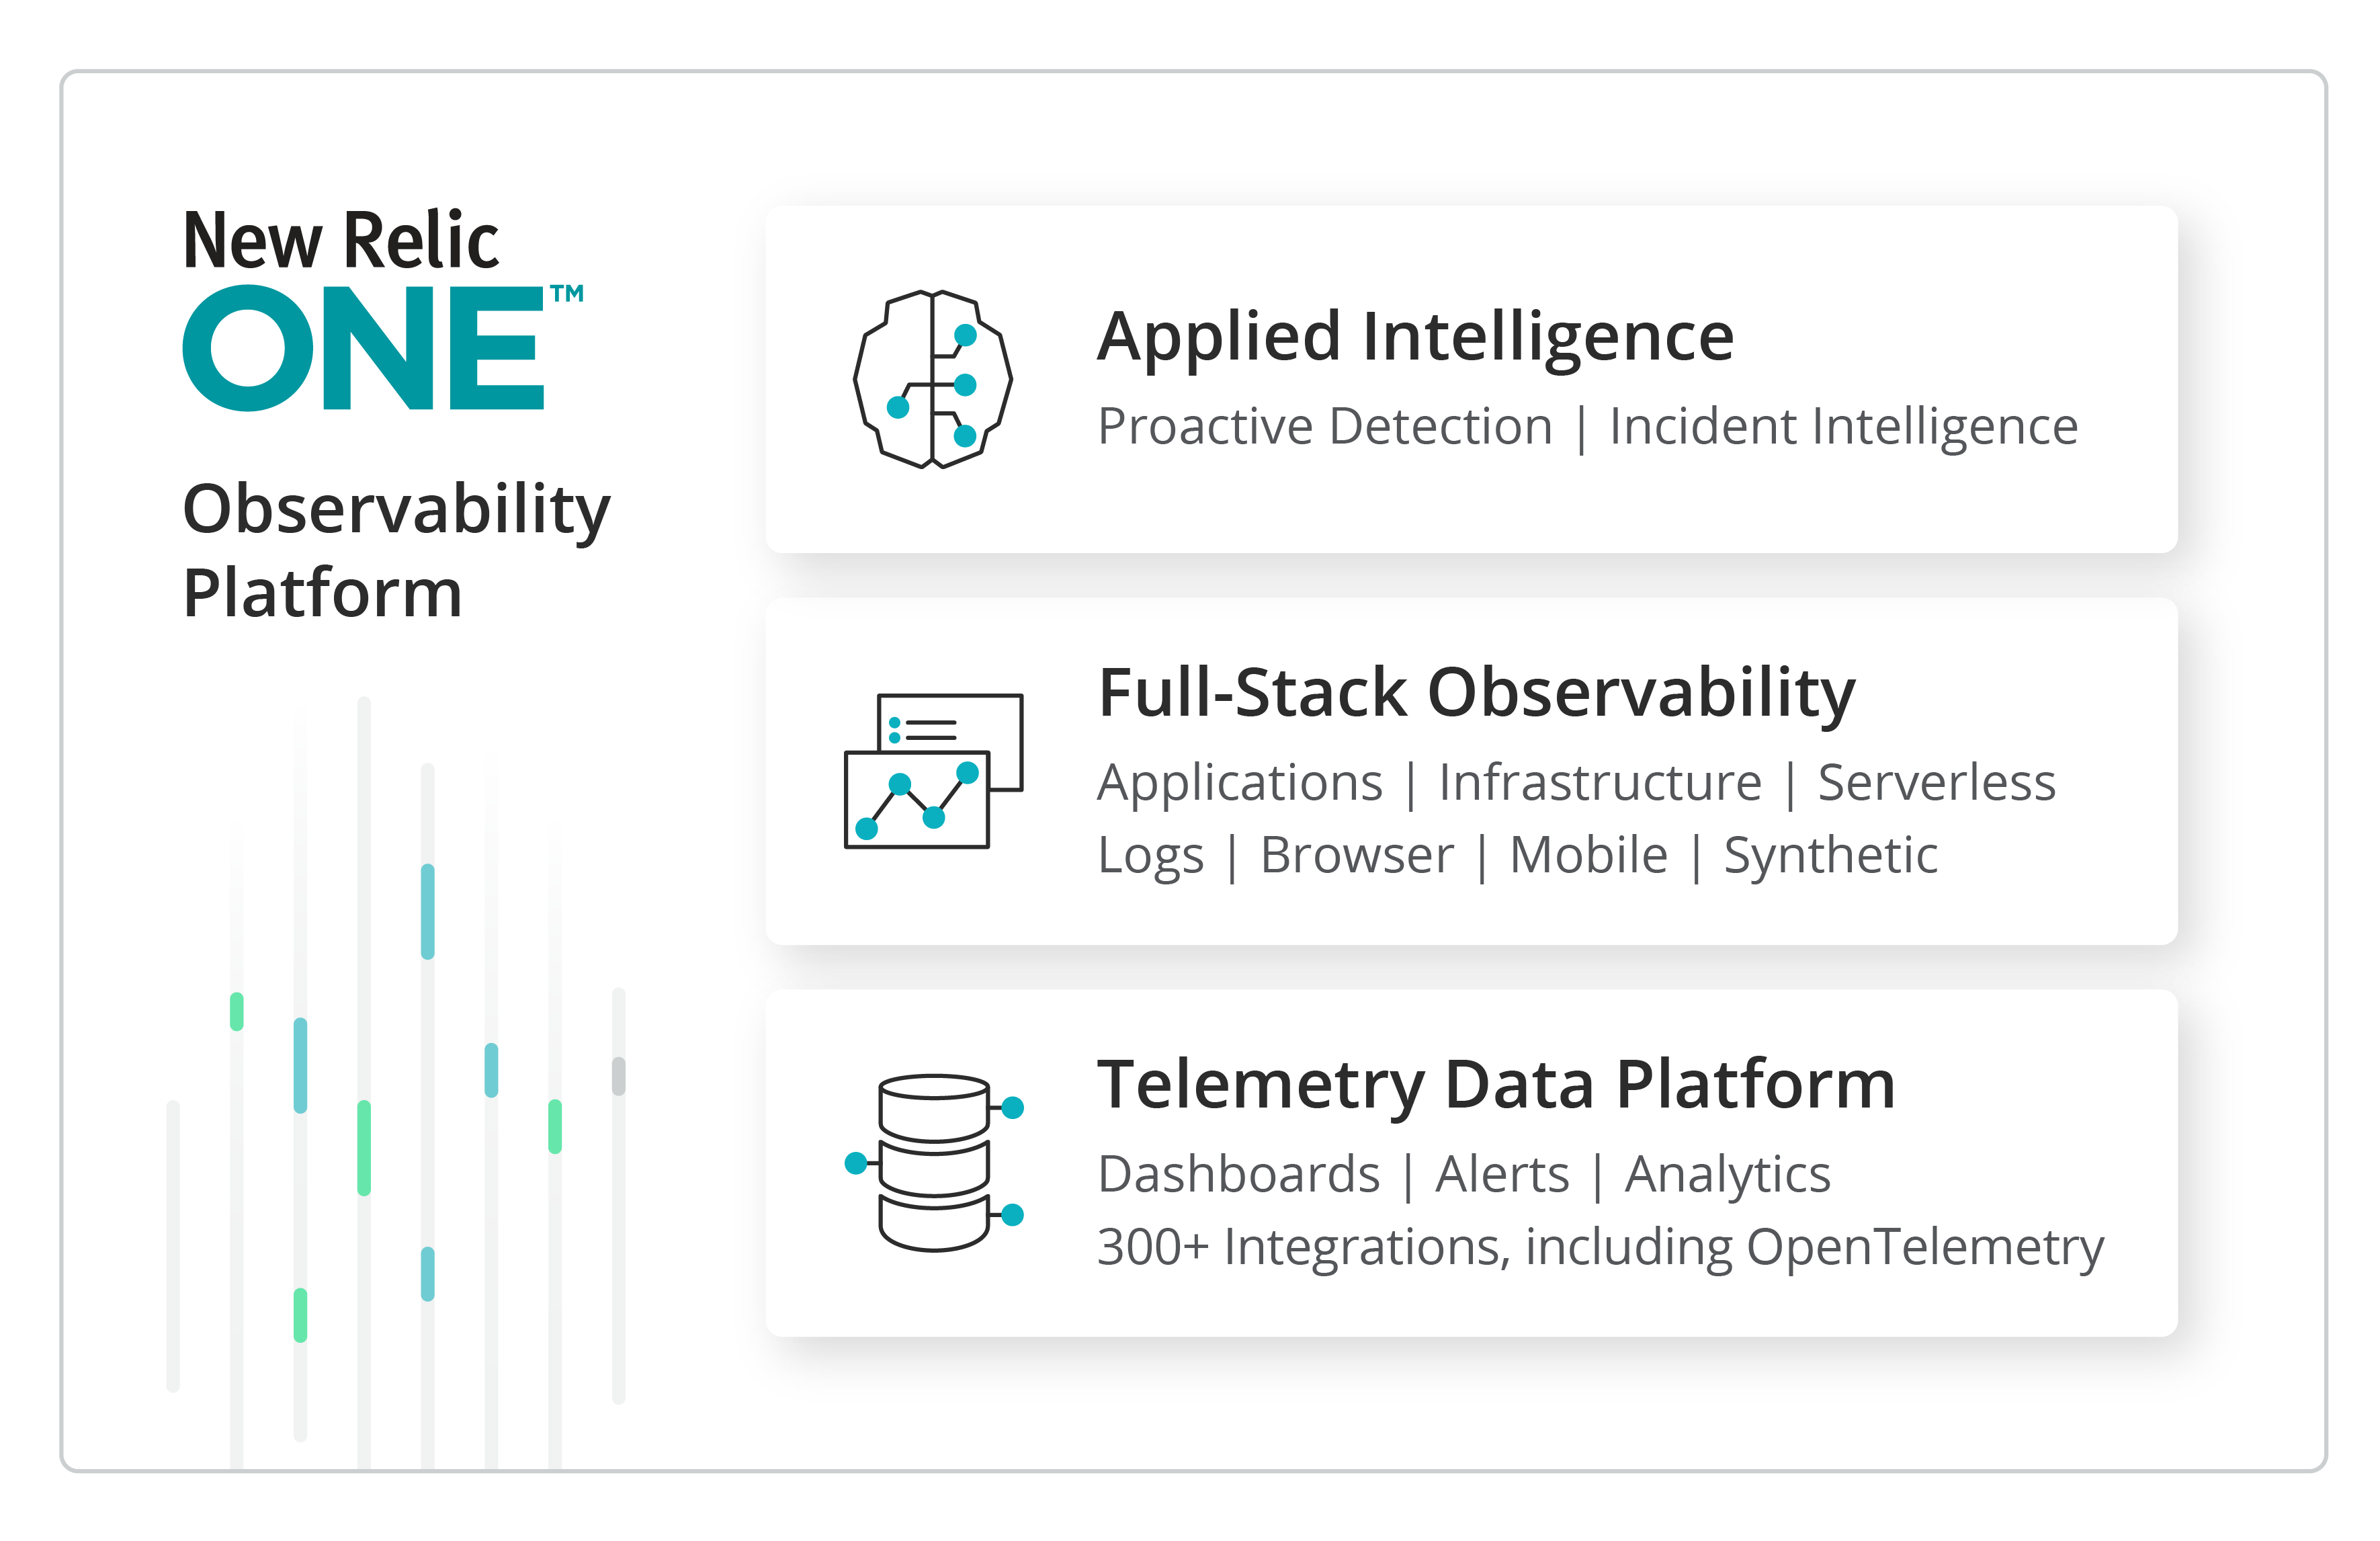
New Relic One is the next evolution of the New Relic platform for observability. It connects all the data your teams need to understand their increasingly complex and interdependent systems. With New Relic One, you can focus on building software for your customers, not your monitoring solution. With New Relic One, all users can access all of the platform to maximize mean time to resolution (MTTR). With the removal of access silos, teams will be able to break down barriers to find better solutions, improved customer experiences, and align to business outcomes.
Today, many teams’ day-to-day monitoring tasks focus on dashboard creation, dealing with the ongoing deluge of alert storms, and trying to get the basics in application and infrastructure performance metrics. These are critical tasks, but ultimately have a plateauing effect on overall value and effectiveness versus the effort required to maintain the services. Observability creates a force-multiplying impact on the ability for teams to not only align to monitoring requirements, but also vastly accelerate alignment to higher value goals. By transitioning to an observability mind-set, teams can align across organizations to provide improved customer experiences and achieve better business outcomes through a deeper understanding of end-to-end customer journeys and pinpoint identification of service impact areas.
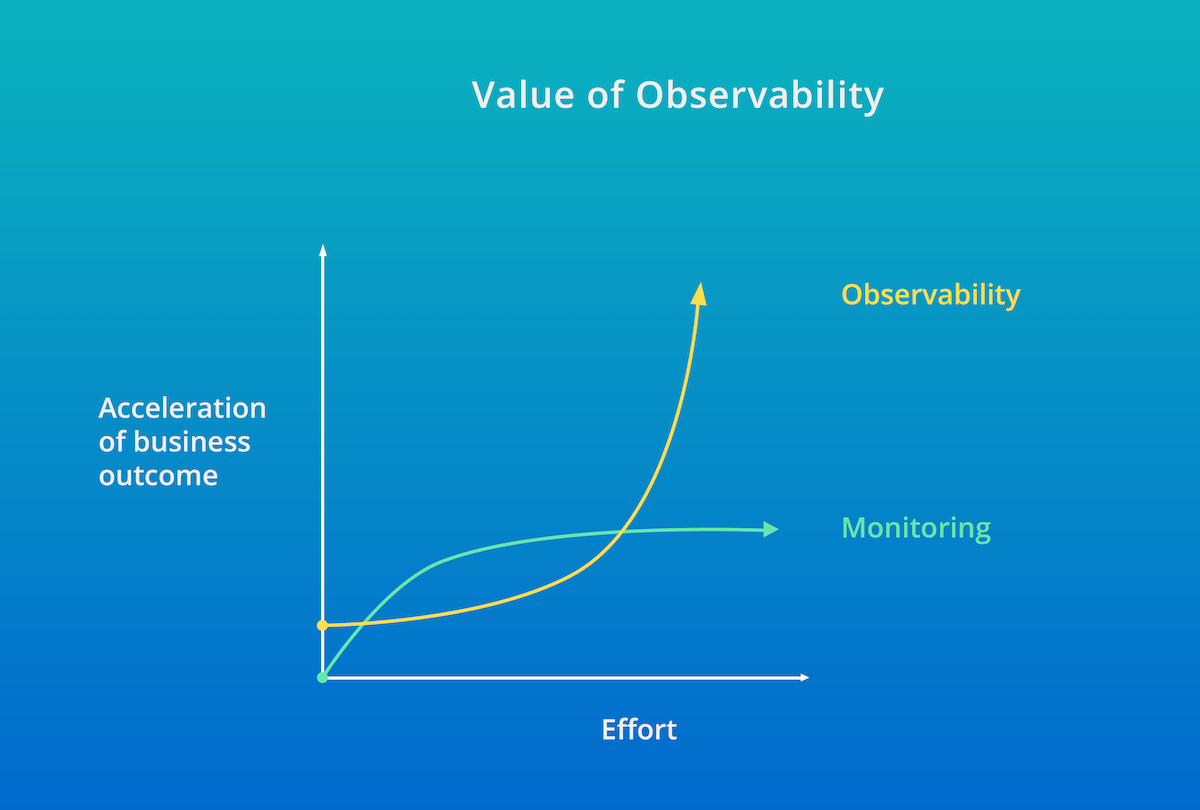
By aligning teams to observability and using the New Relic One platform, teams can achieve broader business goals, while minimizing impact to development pipelines and operational environments.
Deployment
This is an example deployment of a customer that has transitioned to AWS. Within this deployment, the customer is using integrations, logs, AWS services, and Node.js.
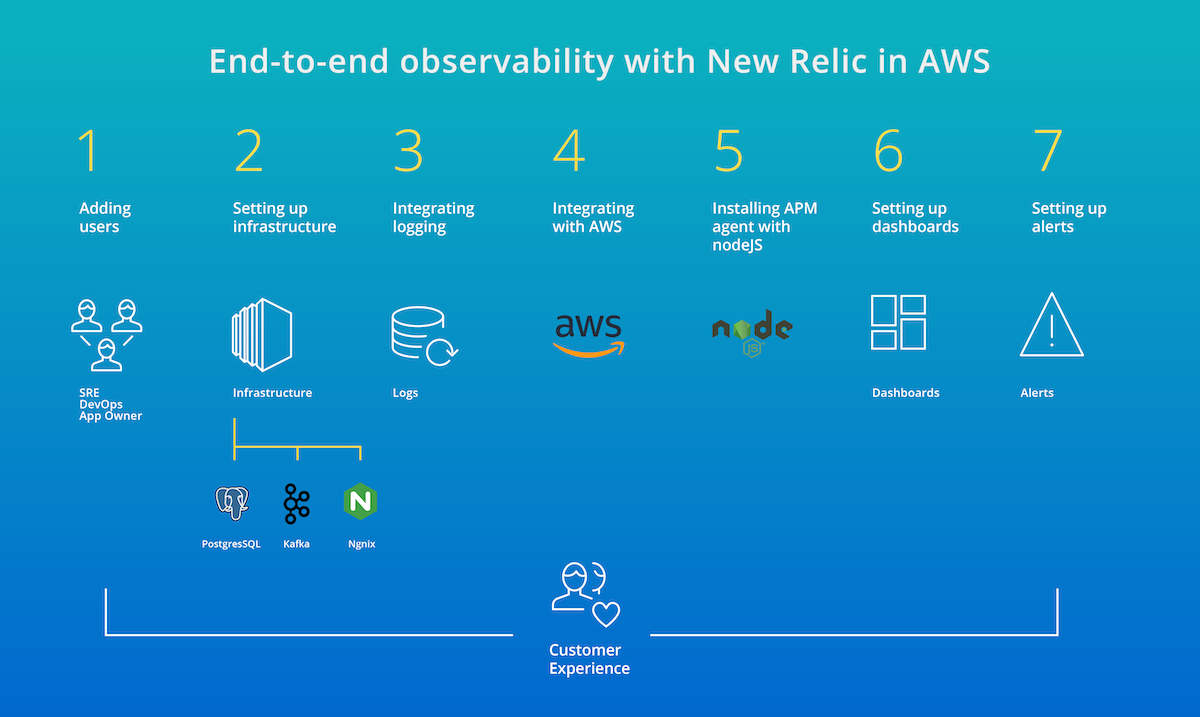
Throughout the rest of this section, you can follow the first steps in using New Relic to maximize your investment in day to day use cases. Leverage all valuable MELT in your environments by installing data agents, instrumenting third-party integrations, and then tying this to your Amazon CloudWatch data. Additionally, it will be critical to tie all of this work into useful dashboards and alerts to minimize MTTR and gain the most value from the New Relic platform. To start, let’s look at how to gain access to the platform.
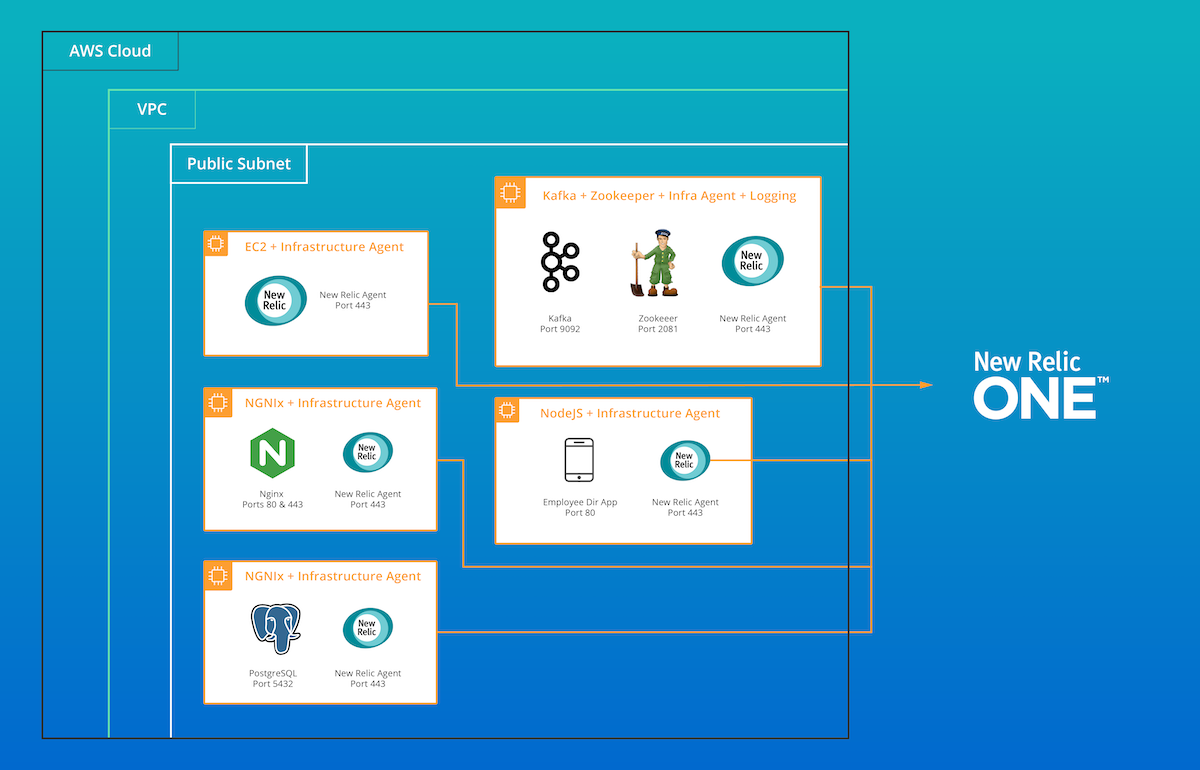
Deployment map of example New Relic environment in AWS.
Adding users
New Relic software provides role-based access control (RBAC). Some New Relic UI features will be visible only to the account Owner or Admins and cannot be seen by Users or Restricted Users. When setting up a new environment, it’s key to know how to add a user and review a user’s role.
To view the list of individuals assigned to your account and their current roles: Go to Your Name (upper right-hand corner) > Account settings > Users and roles.
Additionally, Automated User Manager (AUM) is New Relic’s solution for reducing the toil of user provisioning and de-provisioning. It helps customers manage New Relic users by directly integrating their centralized directories with industry-leading identity providers Okta and OneLogin.
A New Relic account can have one Owner only. To share an account with other users in your organization, create Admins, Users, or Restricted Users.
| ACCOUNT ROLE | DESCRIPTION |
| Owner | The Owner creates the New Relic account and receives all billing queries. The Owner has complete access to all of the account information. The Owner can also install and configure New Relic agents, and he or she can enable or set up features. |
| Admins | One or more individuals can add, edit, and delete account users from (account dropdown) > Account settings > Account. Admins can also install and configure the New Relic agent, and they can enable or set up features. |
| Users | Users are individuals who use (and optionally set up) the available New Relic features. |
| Restricted Users | One or more Restricted Users can view (but not set up or change) any New Relic features. |
For more information, review the New Relic Roles and Permissions Documentation.
Setting up Infrastructure
Once the initial users have been added and logins verified, it is time to begin deploying agents. New Relic Infrastructure Agents support a variety of OS and microservice environments. The data collected by agents are the foundation for Infrastructure-focused areas in the New Relic UI, additional third-party integrations and can be enhanced with AWS-specific metrics for EC2, EKS, VPC, and many other areas.
Let’s start with a single Infrastructure agent deployment, Amazon Linux 2 with the YUM package. Additional details for other Linux installations can be found here.
Install the agent
1. Create the configuration file and add your license key:
echo "license_key: YOUR_LICENSE_KEY" | sudo tee -a /etc/newrelic-infra.yml
2. Add the Infrastructure agent repository:
sudo curl -o /etc/yum.repos.d/newrelic-infra.repo
https://download.newrelic.com/infrastructure_agent/linux/yum/el/7/x86_64/newrelic-infra.repo
3. Update your YUM cache:
sudo yum -q makecache -y --disablerepo='*' --enablerepo='newrelic-infra'
4. Run the installation script:
sudo yum install newrelic-infra -y
5. After a few seconds, your host will appear in the Infrastructure tab of your New Relic instance.
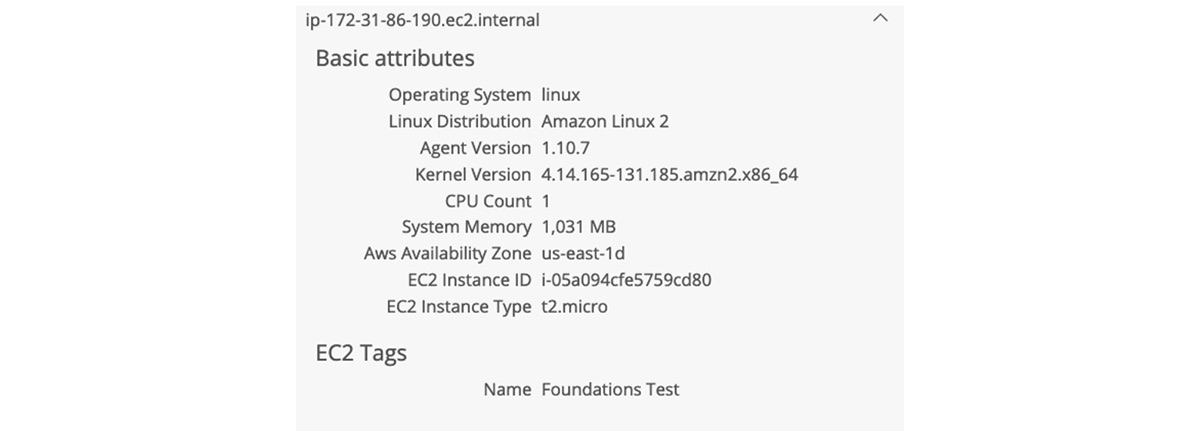
Once the deployment has been verified, you will have access to several valuable UI tools to address observability use cases.
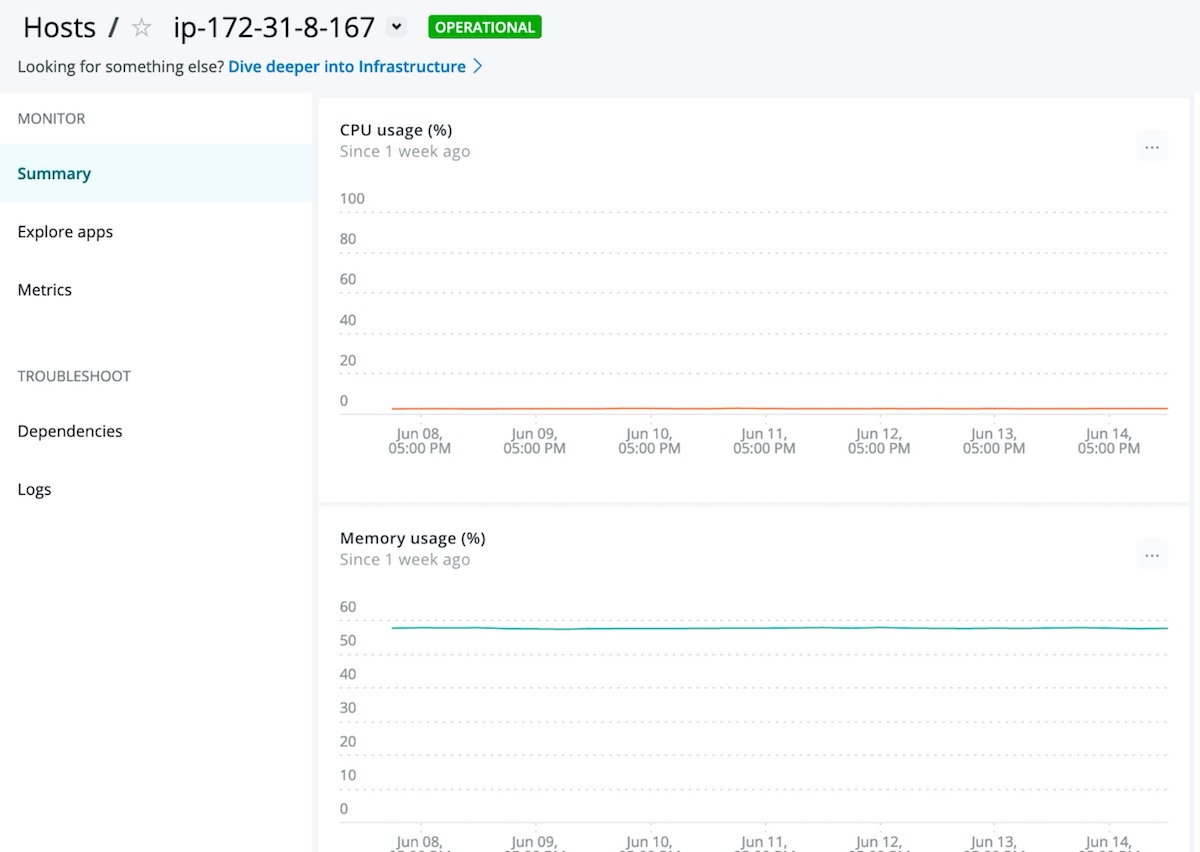
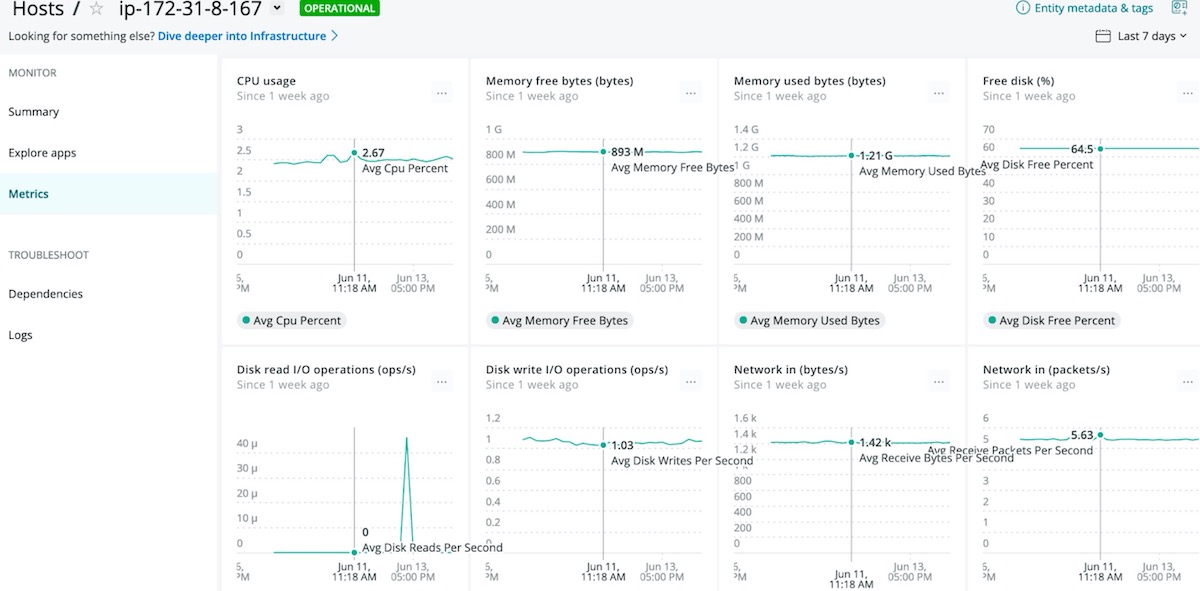
For more information, review the New Relic Infrastructure Documentation.
Now it is time to add integrations. The next section focuses on instrumenting PostgreSQL, Kafka, and NGNIX in your application stack, representing a typical set of technologies that enable an end-to-end customer journey. As you walk through these steps, review the configuration files regarding usernames and passwords, ports, logging levels, whether to use SSL, and other configurable areas.
Integration with PostgreSQL
1. Install the PostgreSQL integration package:
sudo yum install nri-postgresql -y
2. Change the directory to the integrations folder:
cd /etc/newrelic-infra/integrations.d
3. Copy the sample configuration file:
sudo cp postgresql-config.yml.sample postgresql-config.yml
4. Edit the configuration file to enable the integration:
Example configuration:

integration_name: com.newrelic.postgresql

instances:
  - name: sample_postgres
    command: all_data
    arguments:
      username: postgres
      password: pass
      hostname: psql-sample.localnet
      port: 5432
index name.
      collection_list: '{"postgres":{"public":{"pg_table1":["pg_index1","pg_index2"],"pg_table2":[]}}}'
      enable_ssl: false
     timeout:  10
    labels:
      env: production
      role: postgresql
5. Create a PostgreSQL user with read permissions:
CREATE USER new_relic WITH PASSWORD 'PASSWORD';
GRANT SELECT ON pg_stat_database TO new_relic;
GRANT SELECT ON pg_stat_database_conflicts TO new_relic;
GRANT SELECT ON pg_stat_bgwriter TO new_relic;
6. Restart the New Relic Infrastructure agent:
sudo systemctl restart newrelic-infra
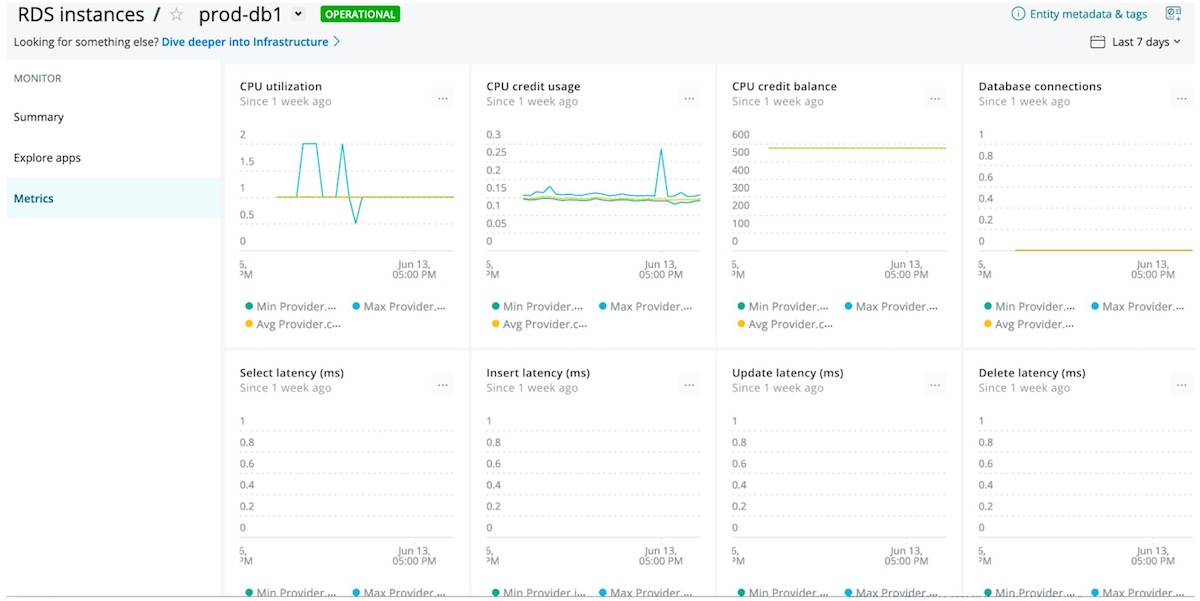
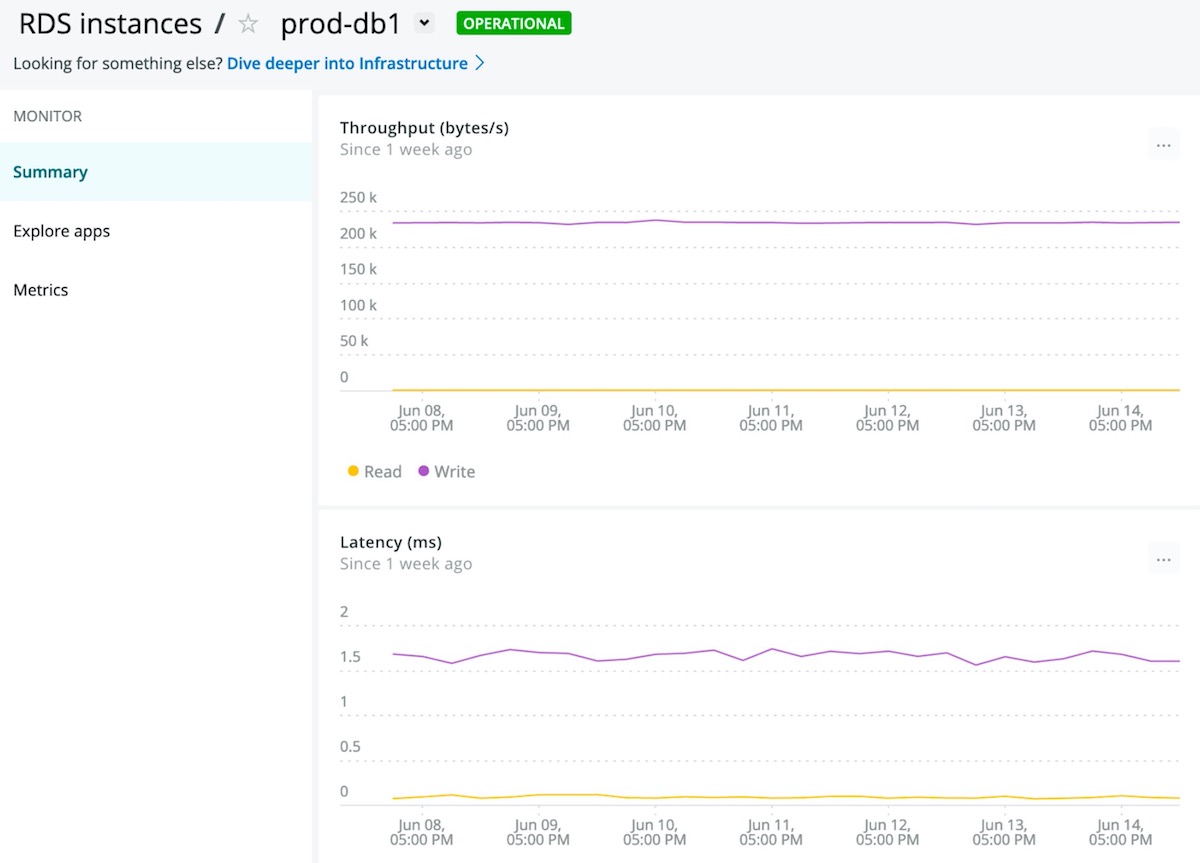
7. After a few minutes, you can review your PostgreSQL integration in the Infrastructure tab under Third-party Services -> Active Integrations.
Integration with Kafka
1. Install the Kafka integration package:
sudo yum install nri-kafka -y
2. Change the directory to the integrations folder:
cd /etc/newrelic-infra/integrations.d
3. Copy the sample configuration file:
sudo cp kafka-config.yml.sample kafka-config.yml
4. Edit the kafka-config.yml as a single node deployment:
integration_name: com.newrelic.kafka

instances:
  - name: kafka-metrics
    command: metrics
    arguments:
      zookeeper_hosts: '[{"host": "localhost", "port": 2181}]'
      producers: '[{"name": "my-producer", "host": "my-producer.my.localnet", "port": 9989}]'
      consumers: '[{"name": "my-consumer", "host": "my-consumer.my.localnet", "port": 9987}]'
      topic_mode: List
      collect_topic_size: false
      topic_list: '["topic_1", "topic_2"]'
    labels:
      env: production
      role: kafka

  - name: kafka-inventory
    command: inventory
    arguments:
      zookeeper_hosts: '[{"host": "localhost", "port": 2181}]'
      topic_mode: Regex
      topic_regex: 'topic_[0-9]+'
    labels:
      env: production
      role: kafka
5. Restart the New Relic Infrastructure agent:
sudo initctl restart newrelic-infra.service
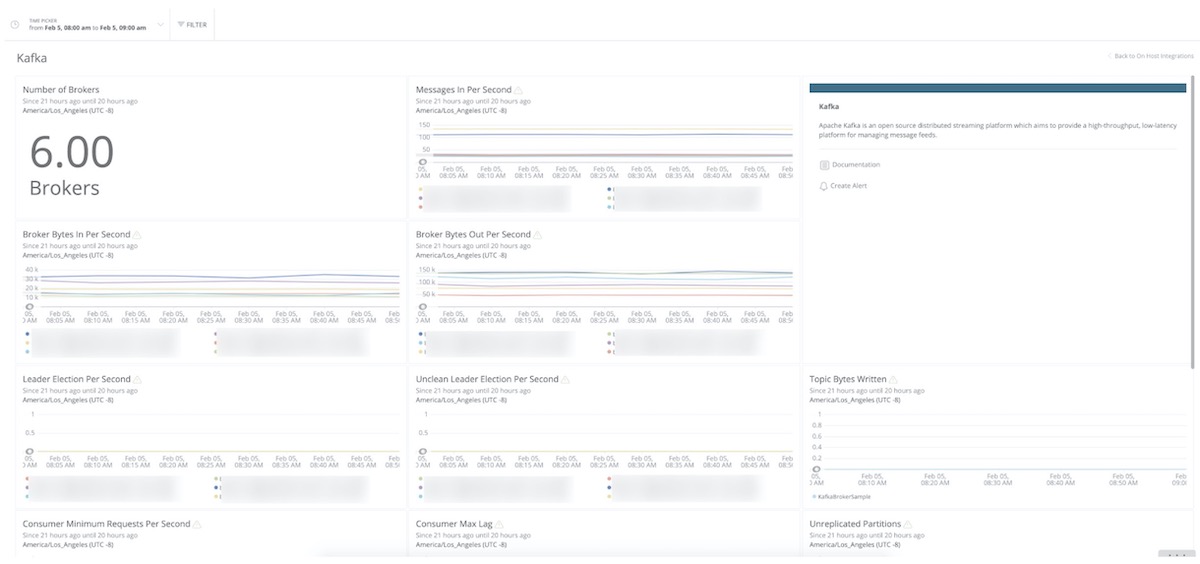
6. After a few minutes, you can review your Kafka integration in the Infrastructure tab under Third-party Services -> Active Integrations.
Integration with NGNIX
1. Install the NGNIX integration package:
sudo yum install nri-ngnix
2. Change the directory to the integrations folder:
cd /etc/newrelic-infra/integrations.d
3. Copy the sample configuration file:
sudo cp ngnix-config.yml.sample ngnix-config.yml
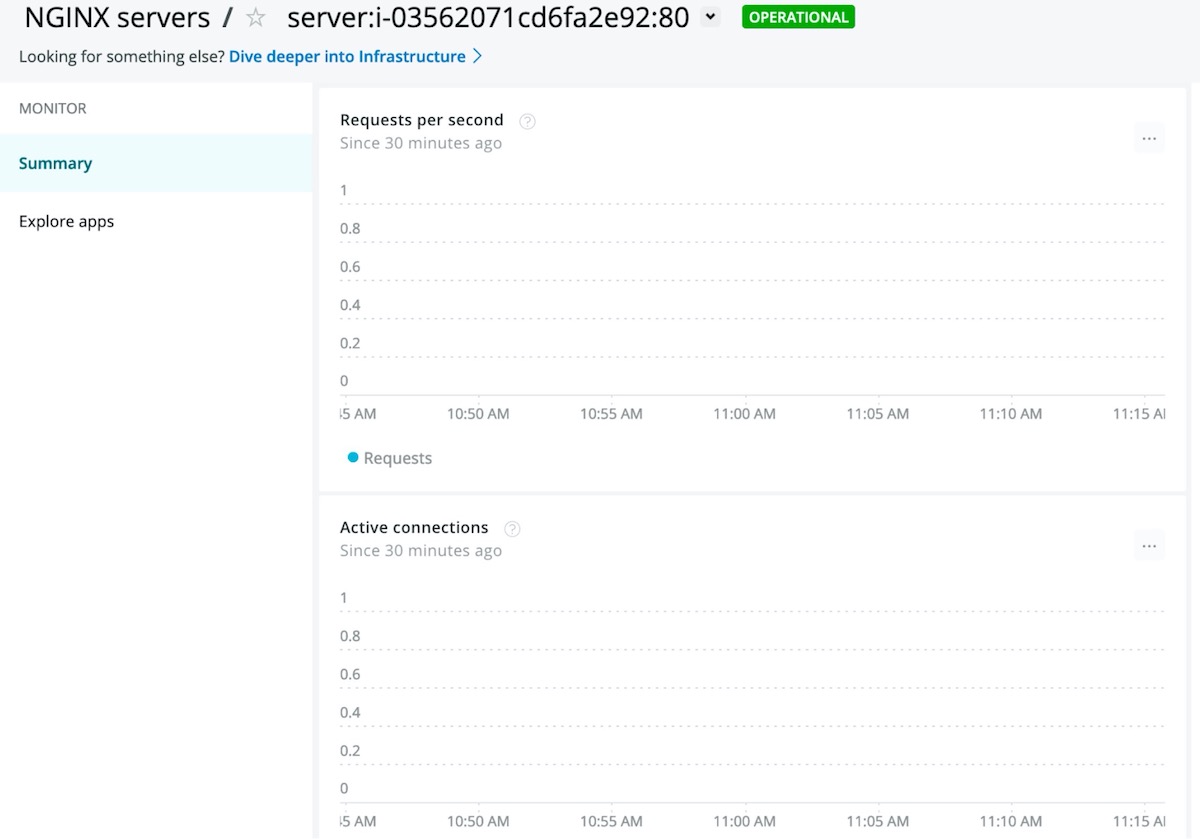
You have created a solid base for monitoring core infrastructure, database, and integrations services. Now you will transition to logging to round out your service side deployments.
Integrating Logging
To enable New Relic Logging with Fluentd:
1. Install the Fluentd plugin:
sudo fluent-gem install fluent-plugin-newrelic
2. Configure your Fluentd plugin and update /etc/td-agent/td-agent.conf:
<source>

  @type tail
  <parse>
 @type none
  </parse>
  path /var/log/*
  tag sample.tag
</source>

<filter sample.tag>
  @type record_transformer
  <record>
    service_name ${tag}
    hostname "#{Socket.gethostname}"
  </record>
</filter>

<match **>
  @type newrelic
  license_key YOUR_LICENSE_KEY
</match>
3. Restart Fluentd:
sudo service td-agent restart
4. Run the following command to append a test log message to your log file:
echo "test message" >> /PATH/TO/YOUR/LOG/FILE
5. Search New Relic Logs for test message.
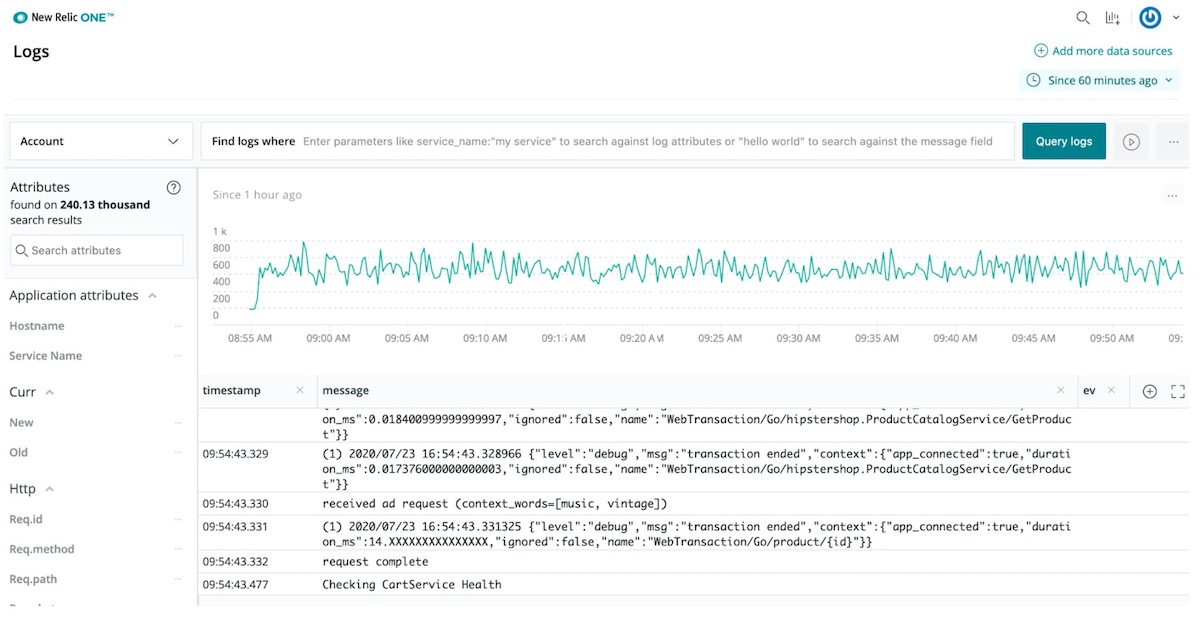
For more information review the New Relic Logging Documentation.
Integrating with AWS
With the Infrastructure, Integration, and Logging deployments complete, it’s time to focus on maximizing your investments with New Relic and AWS. New Relic offers robust integrations with AWS to provide the most up-to-date information about your environments. As part of these integrations, New Relic needs read-only access as a custom policy to your AWS. This example uses AWS IAM Account ID 754728514883 to allow New Relic access to information for EC2, EKS, VPC RDS, Cloudtrail, Lambda, and more.
To connect your Amazon account to New Relic Infrastructure:
1. Go to infrastructure.newrelic.com -> AWS. Click one of the available service tiles to get started.
2. From the IAM console, click Create role, then click Another AWS account.
- For Account ID, use 754728514883.
- Check the Require external ID box.
- For External ID, enter your New Relic account ID.
- Do not enable Require MFA (multi-factor authentication).
3. Attach the Policy: Search for ReadOnlyAccess, select the checkbox for the policy named ReadOnlyAccess, then click Next: Review. Alternatively, you can create your own managed policy and limit the permissions you grant New Relic according to the AWS services you want to monitor.
4. For the Role name, enter NewRelicInfrastructure-Integrations, then click Create role.
5. Select the newly created role from the listed roles. On the Role summary page, select and copy the entire Role ARN (required later in this procedure).
6. Configure a Budgets policy: While viewing the Role summary for your new role, select Add inline policy.
7. Create a Custom policy: Enter a policy name (for example, NewRelicBudget), add the following permission statement, and then select Apply policy.
{
  "Version": "2012-10-17",
  "Statement": [
    {
      "Effect": "Allow",
      "Action": [
        "budgets:ViewBudget"
      ],
      "Resource": "*"
    }
  ]
}
8. Return to the New Relic UI to enter your AWS account name and the ARN for the new role.
9. Select the Amazon Web Services to be monitored with New Relic Infrastructure integrations to confirm reporting under Infrastructure -> AWS.
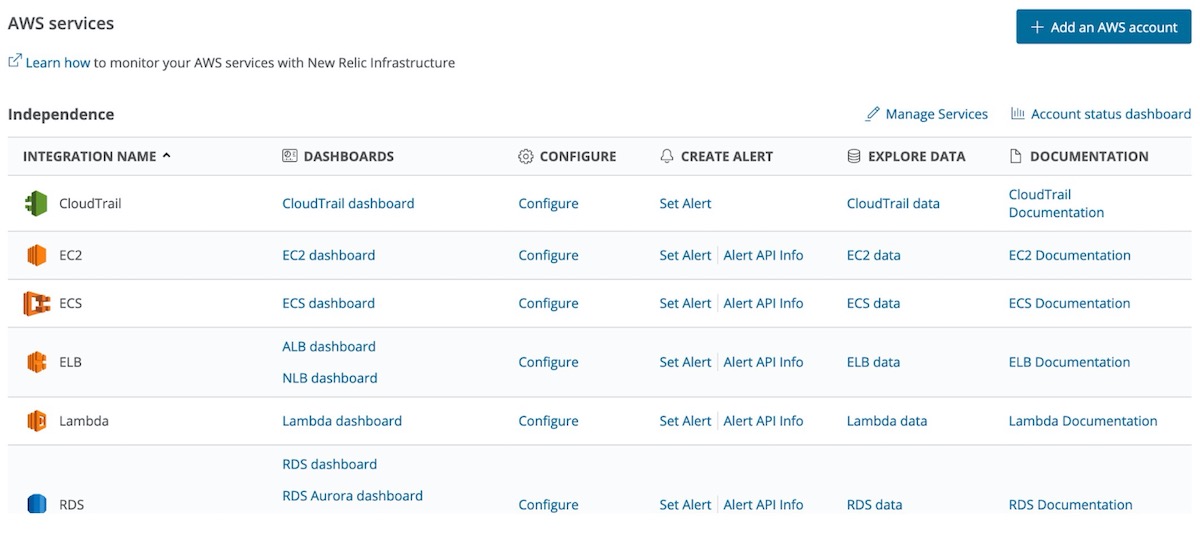
You have verified that AWS is fully integrated with New Relic, and you have access to all of your data from CloudWatch overlaid with all of the other critical observability data collected in the previous steps. As you add new services to AWS, many will be automatically added to the AWS Services overview and incorporated into your overall experience.
For more information review the New Relic AWS Integrations Documentation.
Installing the APM agent with Node.js
New Relic offers deep support for eight software languages (C, Go, Java, .Net, Node.js, PHP, Ruby, and Python) and most critical frameworks with those languages. New Relic’s native support for out-of-the box details and support for critical custom metrics creates a solution that allows you to deploy with confidence. Over time as you grow with New Relic, this level of language agent support removes roadblocks to improving customer experiences and aligning to business outcomes. Recently, New Relic has committed to open source all of our agents to remove deployment friction and improve ongoing customer support.
This example walks through a Node.js application deployment.
1. Install the New Relic Node.js Agent:
Use the command npm install newrelic --save in the root directory for your application
2. Generate the agent configuration file by running the command:
From node_modules/newrelic, copy newrelic.js into the root directory of your app.
3. Configure agent via the newrelic.js file:
- Customize the
license_keysetting with your license key. - Customize the
app_namesetting with meaningful names.
4. Add require('newrelic'); as the first line of your app's main module.
5. Generate some traffic, then wait a few minutes for data to appear in the New Relic APM UI.
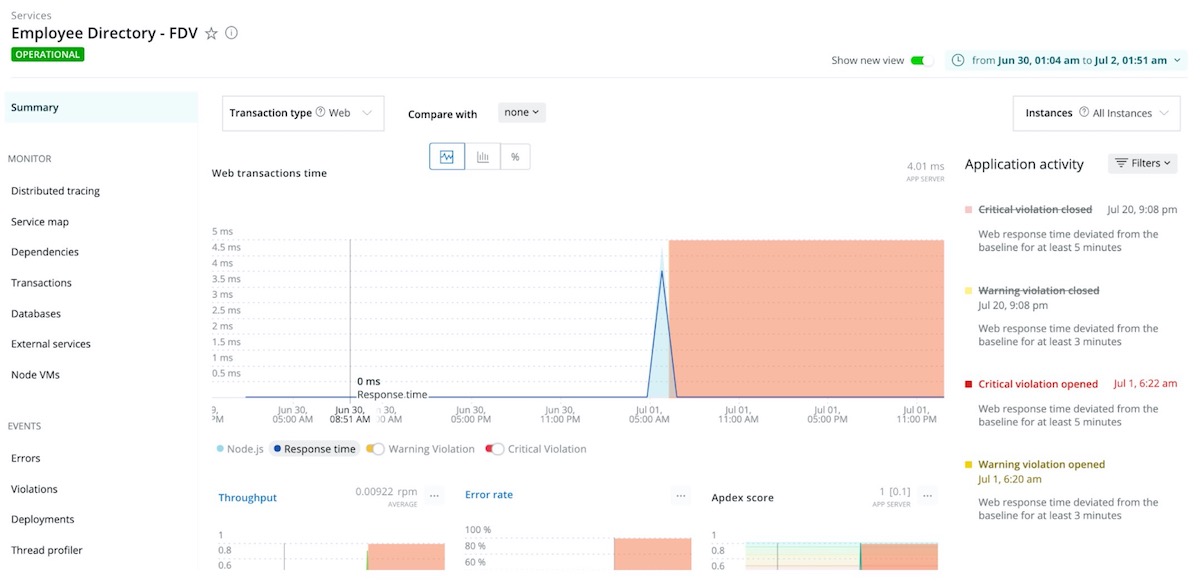
For more information, review the New Relic Node.js Documentation.
You have successfully added your Node.js application to New Relic. You have now completed all of the agent deployment and integration steps. From added users to extending or creating new services, the environment is ready to grow with you. However, this is not the end of the journey. Next, you will learn how to build meaningful dashboards and alerts.
Setting up dashboards
The dashboard experience includes a set of capabilities that creates value through integration—embedding direct access to data visualization and dashboard tools. These features empower you to explore your data when and where you want—without leaving the environment in which you’re working.
Access made easier
You’re never more than one click away from accessing our full dashboard experience.
To access dashboards, click the Dashboards icon from the top home navigation.

To build a new dashboard click +Create a dashboard.
With New Relic One dashboards, you can:
-
Add newly created charts directly to any dashboard to which you have access
-
Call the dashboard builder interface any time you view and edit a NRQL query (whether in a dashboard, the entity overview, or any other location)
-
Use the new global query bar to explore your data anywhere, at any time, within the New Relic One environment
-
Open NRQL views of any chart in New Relic—this is helpful for advanced users or anyone interested in learning how to craft queries directly.
Dashboards that do more—and do it all better
Beyond making it easier to access dashboards and query tools, three new capabilities make it easier to create and manage dashboards:
- Create, customize, and clone dashboards from anywhere in the New Relic platform, using almost any available data source. It’s now possible, for example, to save service maps as a custom widget and then add that widget into a dashboard. Any dashboard can display any type of visualization or data source; no need to define in advance a dashboard-type or otherwise limit how you use a particular dashboard.
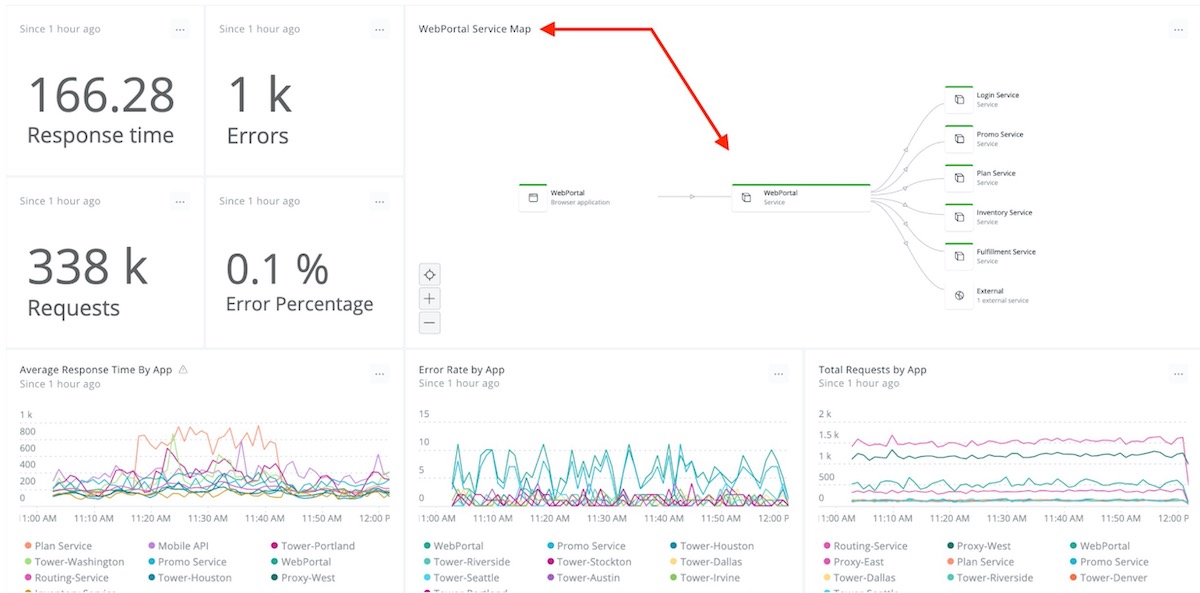
Any dashboard can display any type of visualization or data source (such as a service map, as shown here).
-
A tag API makes it easy to organize and search across dashboards, and to favorite dashboards. All New Relic customers can benefit from quick, personalized access to dashboards when and where they’re needed.
-
Support for dashboard (and chart-level) CRUD (CReate, Update, Delete) controls within chart action menus. If you have permission to access a dashboard, you also can access these basic management capabilities.
Improved data tools offer something for everyone
Looking at the big picture, New Relic One empowers teams to extract useful insights from ever-increasing amounts of data and communicate those insights in ways that support timely and effective decision-making. Those are important benefits—but we understand that users are also concerned about the time, energy, and effort required to achieve them.
That’s why we designed these new capabilities to leverage our existing dashboard technology. All of the time and effort your team has already put into building dashboards retains its full value; dashboards created using Insights are accessible from within New Relic One, and vice versa. And while some of our new capabilities will not be available within Insights (for example, the 12-column layout model), the dashboards are.
There’s truly something for everyone in our new chart builder experience and dashboard capabilities. We’ve worked hard to give our customers a set of tools that make it easy to experiment, learn, and improve. We’re looking forward to seeing where our customers go with these new capabilities—and we hope you’re looking forward to using them.
Setting up Alerts
Alerting is an indispensable practice, keeping your teams informed about potential performance issues before they happen. You can’t possibly watch your site every second of every day. With New Relic Alerts, you don’t have to; when a monitored application, host, or other entity triggers a predefined alert condition, the right members of your team get the alerts they need as quickly as possible. And with features such as incident rollups and prioritized search terms, Alerts helps to minimize the risk that “alert fatigue” will lead to mistakes and miscommunication in your incident response process.
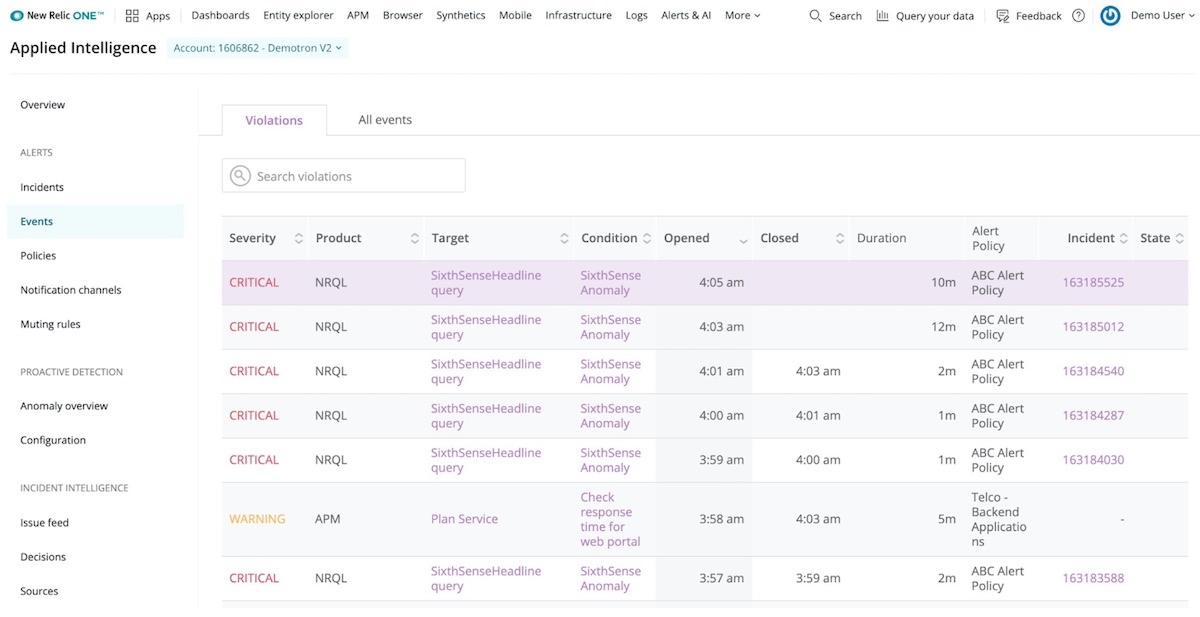
New Relic Alerts offers quick and intuitive access to alert violations that help to resolve critical issues.
Let’s walk through the phases of setting an alert.
Set up policies and conditions
Creating an effective alert policy can be challenging for users who aren’t familiar with New Relic Alerts. Configuring an alert involves three key parameters: developing the correct set of conditions (what you are alerting on), thresholds (the values that will trigger the alert), and notification channels (where the alerts information will be sent). An Alerts policy is a collection of conditions, all designed to target specific entities. A violation is an occurrence of your conditions being triggered by your pre-set thresholds being breached.
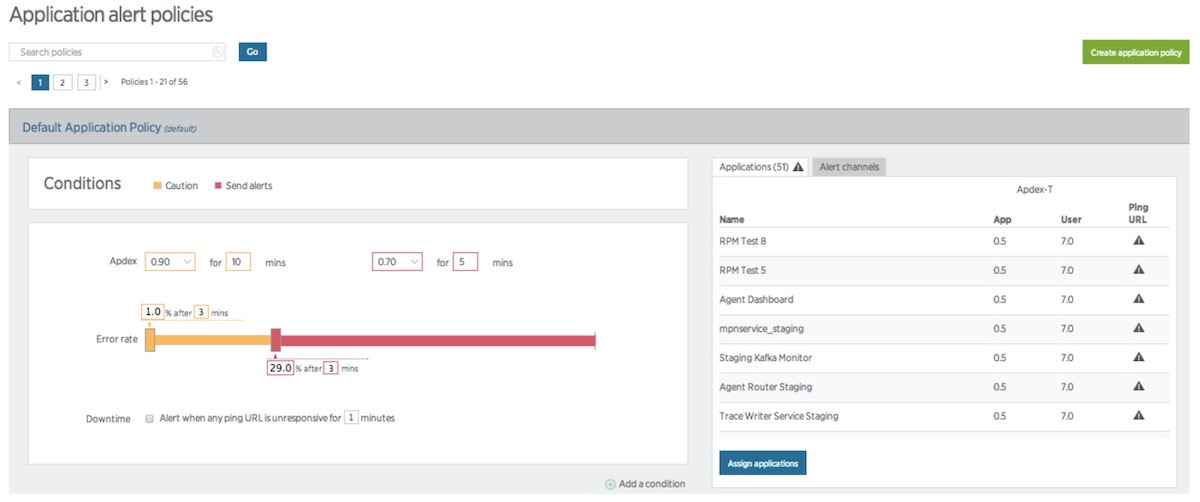
An Alerts policy is a collection of conditions, all designed to target specific entities.
You will want to group your conditions into policies that are appropriate for every team member designated to receive notifications on that policy.
New Relic offers two handy tutorials covering these topics: one focusing on alert policies and another on alert notification channels. You can also learn more about defining alert conditions, configuring alert policies, and working with notification channels in New Relic Alerts.
Choosing and using incident preference
Incident preference in Alerts is a policy-wide setting that specifies the frequency of alert notifications you will receive for each policy. By default, if there’s an open incident (i.e., a condition was triggered, opening a violation that requires attention) for a policy, then any new violation of any condition within that policy will roll up into that initial incident. Your team will have to close the open incident, and a new violation will have to occur before Alerts sends any other notifications for that policy.
A best-practice approach involves setting up an account-wide, standard practice for incident preference in Alerts, helping to ensure that you get the notifications you need when you need them. Alert Incident Preferences are the Key to Consistent Alert Notifications (a New Relic Level Up post) walks you through a detailed discussion of how to use incident preference, how to set alert policies, and related topics.
Set up a notification channel
You can configure a notification channel to automatically send to a specific user on an account, using a particular email address, or by choosing one of several pre-configured integrations with popular messaging services. Webhooks in Alerts can send notifications just about anywhere you can imagine.
Explore an incident
New Relic Alerts offers an incident view feature that groups together all of the violations in a policy and presents them as a timeline. Exploring this timeline gives you a better understanding of what triggered an event, where and how subsequent issues appeared, and how the relationship between all of these issues might inform the resolution process.
Incident context
The New Relic Alerts incident context feature gives teams a fast, reliable, and powerful alternative approach. Incident context analyzes an application or other entity at the time that its performance triggered an alerting threshold. Suppose Alerts detects anomalous behavior that correlates to an alert violation. In that case, it will report that correlation in the incidents UI and, if appropriate, include a link to the relevant New Relic product chart—putting data at a team’s fingertips that might have taken many hours of work to track down before.
Set up a baseline alert
It’s not always a viable (or preferable) option to set a single alerting threshold for your apps on a 24x7 basis. Baseline alerts address this challenge by learning to recognize patterns in your application performance data. Initially, this process requires about two weeks’ worth of performance data. However, over long periods, baseline alerts continue to analyze performance and to establish baselines that make sense for a given period. This allows you to set conditions that trigger when an application’s standard alerting metrics (error rate, response time, etc.) deviate from a baseline that is appropriate for that time—and not simply based on a single, and sometimes inappropriate, threshold.
Learn more about configuring and using baseline conditions in New Relic Alerts.
Best Practices to Get Started
1. Standardize application-naming conventions
Most New Relic agents provide a default application name, such as "My Application" or "PHP Application," if you don't specify one in your New Relic configuration file. You don't want to end up with 20 identically named applications, so always be sure to select a descriptive identifier for your apps as soon as you deploy them.
To keep things consistent and easy to navigate, New Relic recommends standardizing your application naming (for example, all apps in Staging append [Staging] or the like at the end of their names). Ideally, you want your new Java applications to be named automatically to reduce the chances of typographical errors and misnaming.
For Java applications, automatic application naming can come from the following sources:
- Request attribute
- Servlet init parameter
- Filter init parameter
- Web app context parameter
- Web app context name (display name)
- Web app context path
Choose the method that fits best your needs and follow these steps.
For non-Java applications, there are no automatic naming methods, so refer to the documentation for your APM agent.
2. Create alerts
When key performance indicators spike or drop, individuals and teams in your organization need to be notified. Alerting in New Relic provides a set of tools, including dynamic baselines that allow you to detect problems before they impact your end users.
Alert policies can be set up in two primary ways:
-
Static threshold alerts are great when you already know the nature of an application and its normal behaviors aren't likely to change anytime soon. Apdex score, response time, error rate, and throughput are some of the static thresholds on which you can create alert policies.
-
Dynamic baseline alerts make it easy to determine and set dynamic alert thresholds for applications with varying seasonal patterns and growth trends (which make it difficult to set thresholds that define normal behavior). These alerts use baselines modeled from your application’s historical metric data.
Each alert policy can contain as many conditions as you need, and each alert condition includes three components:
-
Type of condition (metric, external service, and so on)
-
Entities that the policy targets (for example, apps monitored by New Relic APM or New Relic Browser, hosts monitored by New Relic Infrastructure, and so on)
-
Thresholds that escalate into alerting situations with increasing severity
Once you have your alerting set up, you then want to make sure you're taking advantage of all viable notification channels. After all, what good are alerts if no one knows about them?
You can manage alerts by creating specific user groups and leveraging New Relic's integrated alert channels, including Slack, PagerDuty, webhooks, and email. Be sure to evaluate alert policies regularly to ensure that they are always valid.
3. Track deployments
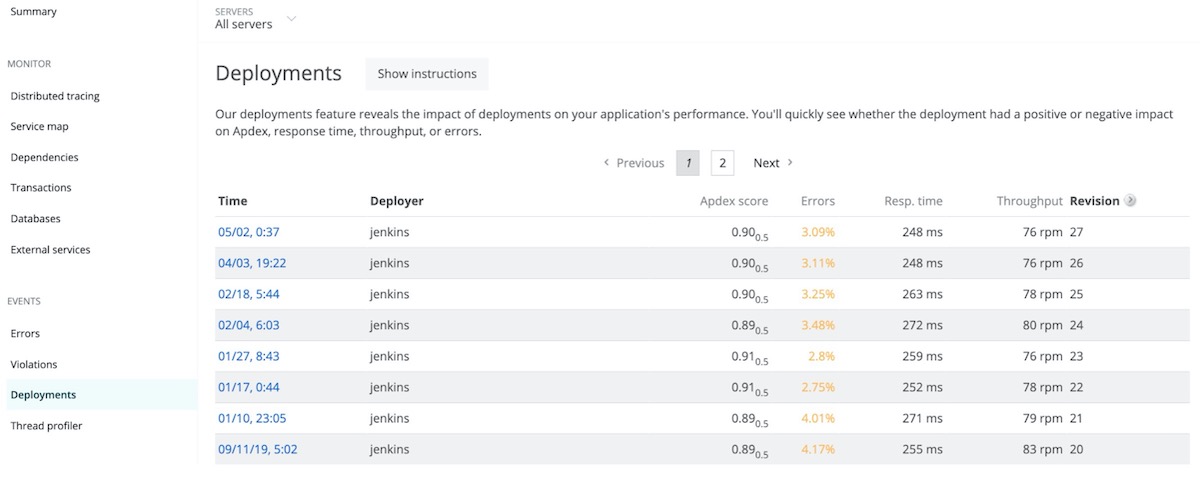
When development teams push new code out as frequently as possible, it can be hard to measure each deployment’s impact on performance. You can use deployment reports to stay in tune with how these changes affect your application.
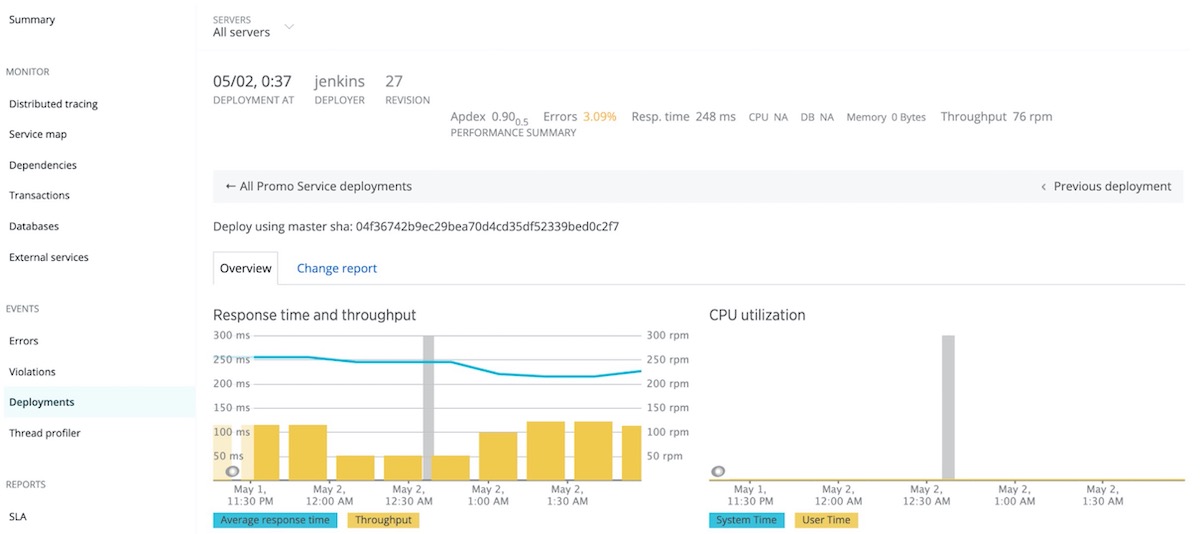
These reports list recent deployments and their impact on end users and app servers' Apdex scores, response times, throughput, and errors. You can also view and drill down into the details to catch errors related to recent deployments, or file tickets to share details with your team.
To access deployment reports:
-
From the New Relic menu bar, select APM > (selected app) > Events > Deployments.
-
To view performance after a deployment, select the timestamp for the requested deployment.
3. Review the changes.
4. Troubleshoot errors with error analytics
The New Relic APM error analytics feature gives you useful tools to analyze and resolve errors being reported by your applications, so you can immediately see where to focus your attention. All teams can:
-
Assess the health of applications with fine-grained data on error events from the past eight days.
-
Select any parameter to group or filter errors shown, such as error class, error message, host, transaction name, etc.
-
Drill down into stack trace details to diagnose and resolve specific errors.
-
Identify continuing trends in error rates for periods longer than eight days.
-
Use links to share error data through New Relic Insights dashboards or through your organization's ticketing system to coordinate and resolve errors more quickly.
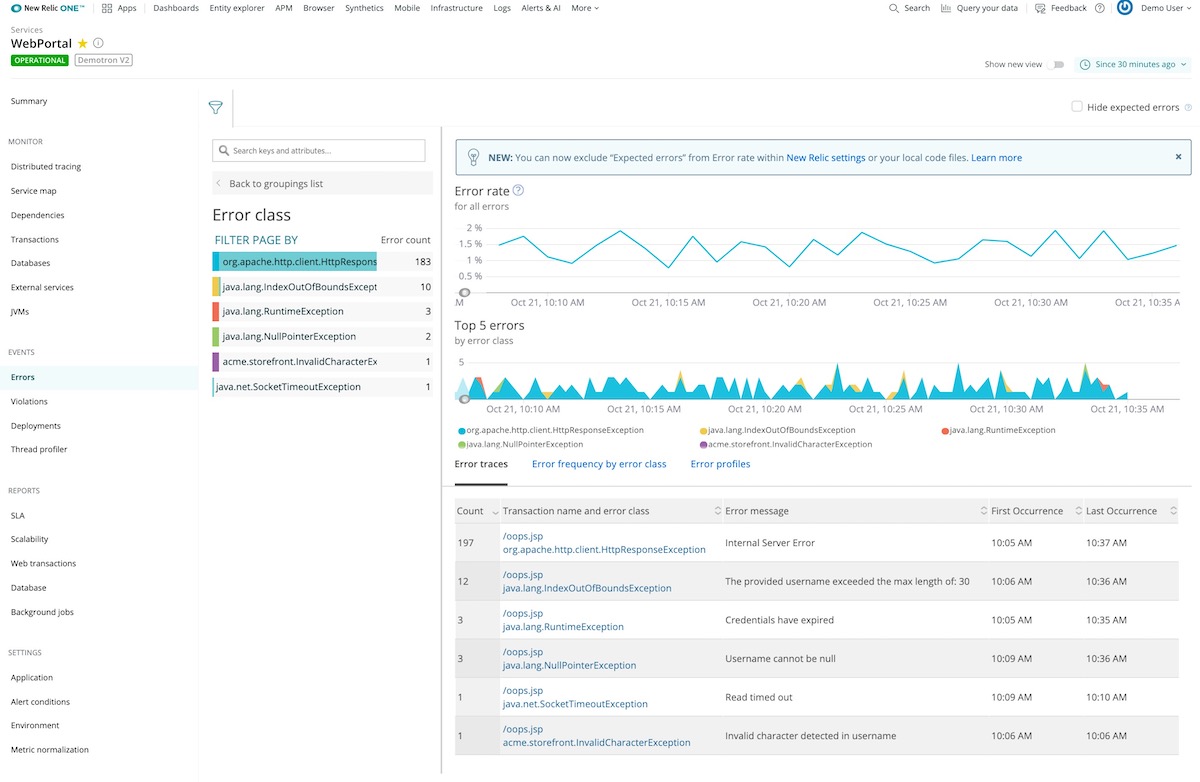
How to use New Relic APM error analytics:
1. In APM, deselect Show new view.

-
Start with the Error rate chart to see at a glance where there are unexpected spikes, dips, or patterns in general.
-
Correlate general patterns on the Top 5 errors chart to alerts occurring during the same period. Use groups and filters to examine the error events and attributes in more detail, and look for patterns with error messages or transaction names.
-
Explore and share Error trace table information, including specific stack trace details: associated host, user, framework code, customer attributes, etc.
-
Identify error patterns on the Error frequency heatmap for a selected grouping (host, error message, custom attributes, etc.) within a time range.
5. Review APM reports
From SLA, deployment, and capacity to scalability, host usage reports, and more, New Relic APM offers a variety of downloadable reporting tools surfacing historical trends—all great ways to report to senior executive teams or customers. Take a look at the full list of reports and use them to your advantage.
How to do it:
-
From the New Relic APM menu bar, select Applications > (selected app) > Reports.
-
Select the report you'd like to see.

-
If you want to save or export a report to share, select Download this report as .csv, which will create a report with comma-separated values.
6. Keep your agents current
With New Relic’s SaaS platform, getting new features is as easy as updating your agent. Most likely, your organization already has a set of scripts for deploying application upgrades into your environment. Similarly, you can also automate your New Relic agent deployment to ensure that your systems are up to date. Both Puppet and Chef scripts are great examples of deployment frameworks that make life easier by allowing you to automate your entire deployment and management process.
How to do it:
Regularly review which version of the agent you're using to know when an update is needed. If the latest agent release contains a needed fix or added functionality, download it.
To deploy the agent automatically (preferred as a method to avoid errors):
-
Use existing deployment scripts, provided they can be adapted to handle the deployment.
OR
Create and maintain a script that specifically deploys and configures the New Relic agent. Ideally, the script would pull the agent files from a repository where the files are versioned (for rollback purposes).
-
Once the script has been created, shut down the application (unless the script handles this).
-
Run the deployment script.
-
Start the application (unless the script handles this).
-
If problems arise, run the script to roll back to the previous version.
To deploy the agent manually:
-
Back up the current agent directory.
-
Deploy the updated agent into the existing agent directory.
-
Modify configuration files by comparing new files with existing files. In particular, make sure information such as license key and custom extensions are copied over to the new configuration.
-
Restart the application.
-
If problems arise, restore the old agent using the backup and restart.
7. Manage user access and enable RBAC and single sign-on (SSO)
New Relic allows authorized individuals to access the broadest possible amount of data, regardless of their assigned role. As an Owner or Administrator of your New Relic account, you can control the permissions of individual users or entire roles with RBAC. To find out what is possible and how to make changes, see Users and roles.
Security is no doubt of the utmost concern to your organization. To simplify password management for your employees and strengthen security, you might already be using SSO with your other systems. You should do the same with New Relic.
Using New Relic's SSO integration feature, account administrators will be able to enforce strong passwords and restrict login via a corporate authentication mechanism. This way, New Relic users who have already authenticated using a corporate SSO system will bypass the New Relic login prompt.
How to do it:
-
Log in to New Relic as an admin and go to the SSO configuration page. From the top navigation in New Relic One, select Your account name > Account Settings > Integrations > Single Sign On.
-
From the SAML Single Sign On page, review your New Relic SAML Service Provider details.
-
To upload your SAML Identity Provider certificate, select Choose File, and then follow standard procedures to select and save the file.
-
Copy and paste in (or type) the Remove login URL that your users will use for Single Sign-On.
-
If your organization’s SAML integration provides a redirect URL for logout, copy and paste in (or type) the Logout landing URL; otherwise, leave blank.
-
Save, test, and enable.
For additional learning resources and help with APM best practices, check out New Relic University’s online course Get Started with APM and New Relic Alerting.
Checklist
- Add Users
- Set up Infrastructure Agent
- Set up Postgres Integration
- Set up Kafka Integration
- Set up NGNIX Integration
- Set up Logging Integration
- Set up AWS Integration
- Set up APM Agent
- Set up Dashboards
- Set up Alerts


