Enterprise DevOps teams today need integrated monitoring solutions that not only consolidate reporting across a number of business functions, but provide meaningful insights that enable cross-functional teams to move faster. New Relic for Microsoft Azure lets teams instrument everything for better visibility into applications, managed services, infrastructure, containers, microservices, and more. Performance metrics and events across the entire solution stack can be collected, correlated, and delivered back as actionable insights that empower DevOps teams to confidently adapt with changes.
Key benefits
- Full-stack monitoring gives you comprehensive visibility across the software stack in one unified experience.
- Quickly identify, triage, and delegate application and infrastructure issues between engineers and ITOps teams, reducing friction.
- Focus on work that most impacts the customer experience by identifying which services and systems are performing poorly.
- See how service dependencies impact the complete solution through cross application tracing via service maps in New Relic APM.
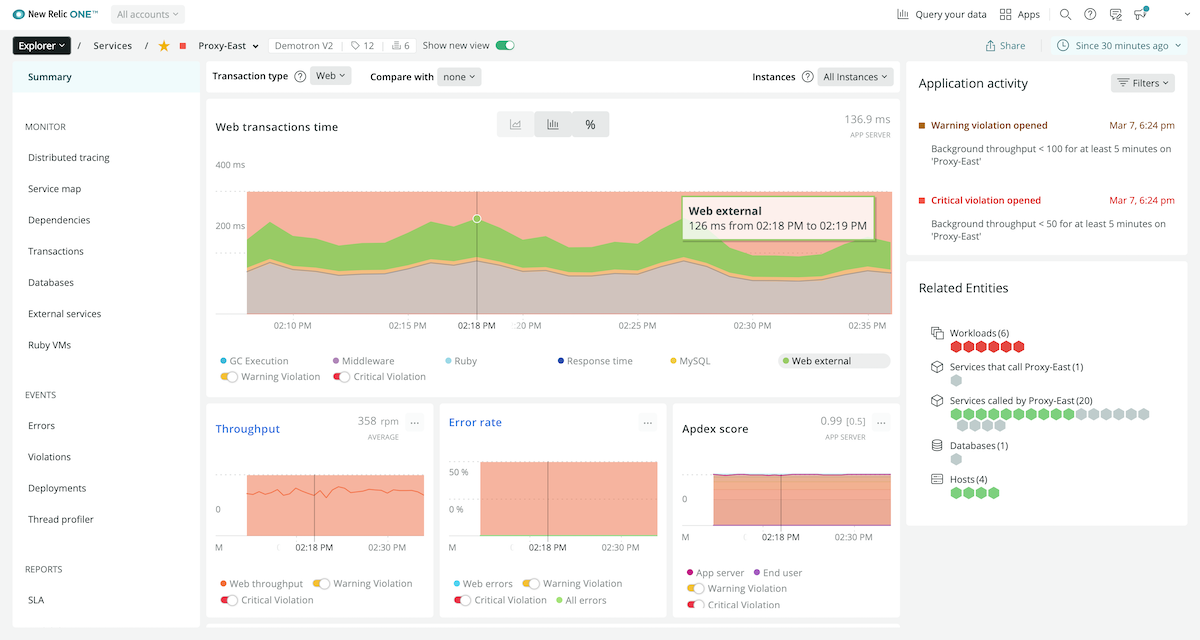
Modern SaaS APM
Application performance traces, metrics, and events are collected and sent to the New Relic One platform, where they are ingested, transformed, and delivered back to users as insights via an intuitive web interface. Teams can quickly identify, triage, and resolve complicated issues that may span cross-functional teams and technologies.
Monitor apps and services built using:
- C
- .NET
- PHP
- Java
- Go
- Ruby
- Node.js
- Python

Monitor all your infrastructure in one place
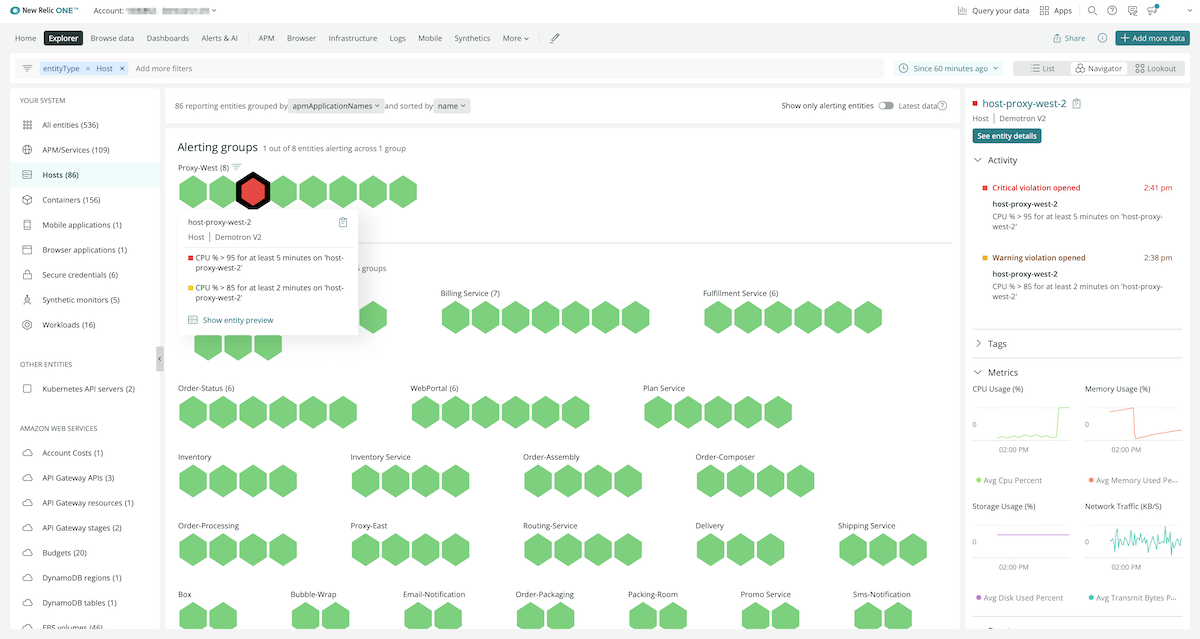
New Relic Infrastructure Monitoring lets you see all your resources, independent of how or where you choose to run your infrastructure. Hybrid and multi-cloud monitoring lets you see Azure hosts alongside on-prem Windows and Linux machines as well as hosts on other cloud platforms. See which applications and services are running poorly on specific hosts and drill down with APM to find the root cause.

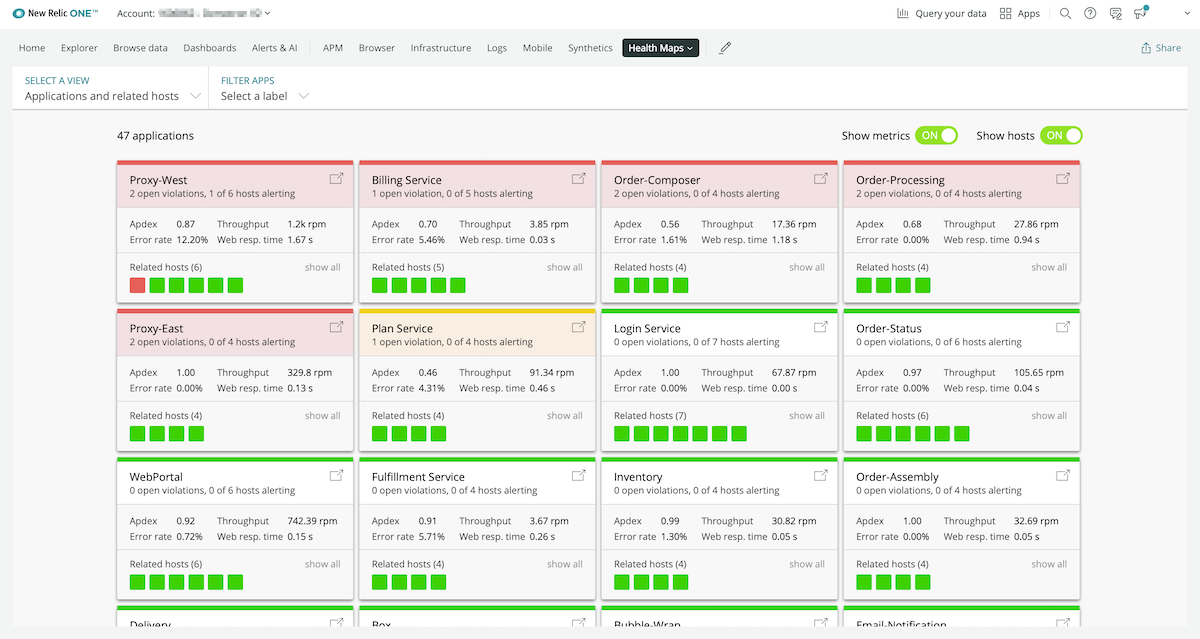
Correlate apps and hosts
Health map enables DevOps teams to better understand how applications are running on clustered hosts they’ve been deployed to. A prioritized color-coded view makes it easy to quickly identify problem areas and drill down into specific hosts.

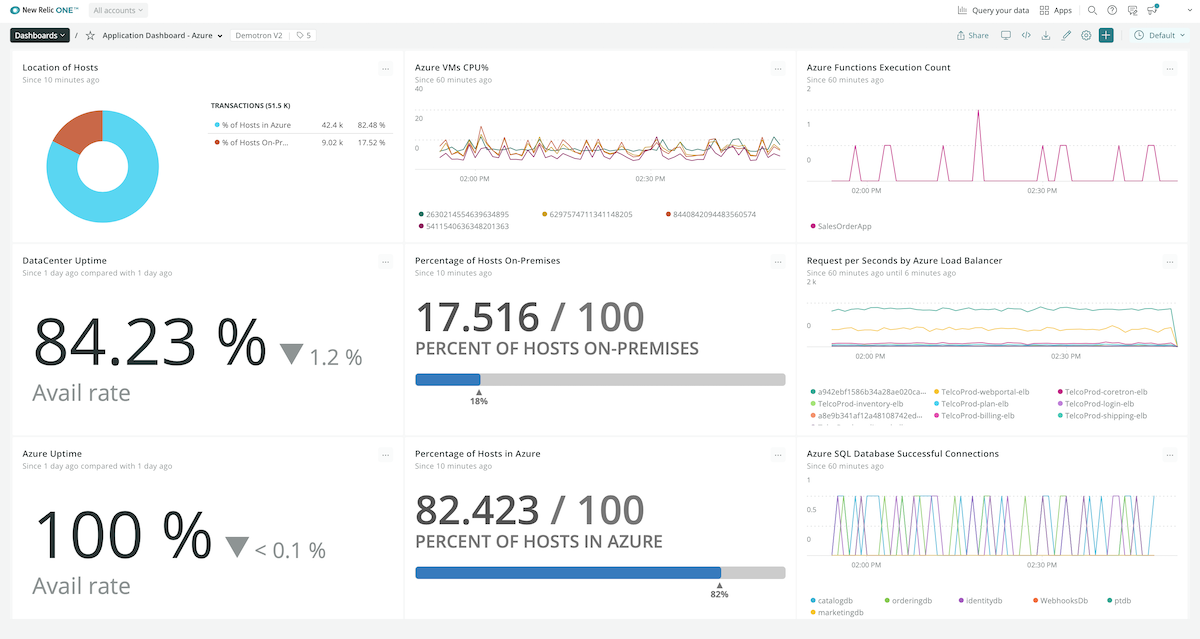
Cross-platform dashboards and alerts
Show that enterprise DevOps on Azure accelerates business, turning goals into quantifiable success. See how code deployments affect the customer experience with customizable dashboards displaying team KPIs across the full stack.

Visibility into Azure services
New Relic Infrastructure monitoring integrations allow you to monitor the real-time status of many popular Azure services:
- Azure Virtual Machines
- Azure Functions
- Azure Cosmos DB
- Azure Service Bus
- Azure Virtual Networks
- And many more!
“Using New Relic, we can easily instrument any application delivered on Azure and gain visibility into key performance and usage metrics.”
—Steve Novoselac, Director of Digital Product Management, Trek Bicycle Corp.
Open a window into your Azure development
Actionable performance insights for your applications, services, and infrastructure on Azure using New Relic.


