Introduction
Startups today often brag that they were born in the cloud. As legacy organizations modernize, they too are adopting the cloud at rapid pace, eager to take advantage of the flexibility, resiliency, and time-to-market their cloud native peers enjoy. Whether your organization was born in the cloud or not, your team is likely prioritizing a cloud native mindset.
While many organizations are somewhere in the process of defining and optimizing their cloud approach, there’s still a fair amount of confusion among IT practitioners and decision makers about what “cloud native” really means and what the ultimate goals and expectations should be for an organization leveraging modern technologies and practices.
Whether you’re just getting started or are well underway on your cloud native journey, this ebook presents three prescriptive technical and cultural capabilities essential for optimizing your cloud native environment.
Three core capabilities for cloud native success
-
Adopt easily. Get the visibility and data-driven insights your teams need to make smart architecture decisions, from deciding which services to adopt to understanding how to break down your monolith into microservices.
-
Experiment confidently. Deploy new features and fixes and get fast feedback so you can find errors in your complex, distributed environment before your customers do.
- Scale better. Leverage the contextual data required to automate and grow your services efficiently across your entire stack, from the hosts that support your applications to the individual customer experiences they enable.
Adopt new technologies easily
The rate at which cloud providers unveil new services and technologies can be staggering. You must be able to evaluate and adopt new services with ease and confidence. You also need visibility and data-driven insights to accelerate the pace of application releases and achieve measurable business objectives. To optimize your cloud native environment, you need to:
- Define SLOs for your cloud native environment
- Adopt modern technologies and cloud services
- Migrate to microservices
Define SLOs for your cloud native environment
An optimized cloud native environment requires a cultural shift—one that enables teams to build new skills and motivations for the type of cross-team work required in distributed, modern cloud environments. The transformation can be difficult if the people involved don’t clearly see the benefits of change.
Service-level objectives (SLOs) are a powerful mechanism for codifying team goals in a way that stakeholders can measure and share. An SLO is an agreed-upon means of measuring the performance of an application or microservice within an application. The SLO defines a target value for a specified quantitative measure, which is called the service-level indicator (SLI); for example:
-
(SLI) = average response time (SLO) = should be less than 200 ms
-
(SLI) = 95% of requests (SLO) = should complete within 250 ms
-
(SLI) = availability of the service (SLO) = should be 99.99%
As such, SLOs provide clear boundaries on service expectations, offering greater velocity and freedom to teams that are experimenting with new approaches, especially in cloud native environments.
Effectively setting SLOs and SLIs for a modern, complex system is a multistep process that includes:
-
Identifying system boundaries within your application
-
Defining the capabilities of each system
-
Measuring performance baselines
-
Defining an SLI and applying an SLO for each capability, and then iterating on those settings over time
Using SLIs as key performance indicators (KPIs) can help you ensure your app meets customer expectations. Further, measuring the current state of your service or application’s reliability provides clear visibility into your cloud native environment. Such measurements allow you to focus on resolving meaningful performance gaps as you assess future cloud-based optimization efforts.
Adopt modern technologies and cloud services
Whether you’ve recently completed your cloud migration, have been using cloud-based services for a while, or have always been in the cloud, you’ve likely deployed some modern, cutting-edge technologies and services. It’s important that you adopt new services easily and with confidence. Innovation never stops for a company operating in the cloud, and a company's effectiveness at embracing new platforms can be a major competitive advantage.
The cloud is abundant with modern technologies. A vast majority of cloud native teams run some sort of container solution such as Docker, Kubernetes, AWS Elastic Container Service (ECS), or Fargate, for example. More advanced teams run serverless services such as AWS Lambda, Microsoft Azure Functions, or Google Cloud Functions. And there is no shortage of cloud-based databases and other services that abstract the service away from an operations-maintained infrastructure.
To excel in the cloud, it's essential that you can monitor, query, and alert on the performance and usage metrics for both modern technologies and cloud-based services. This allows you to deploy faster, to adopt new services with confidence, to make better business decisions, and expand your technological horizons.
Migrate to microservices
As IT and operations departments seek to optimize their applications, they’re decomposing application monoliths into microservices. A microservice architecture is an approach that delivers a single application as a suite of small services, each running in its own process and communicating with lightweight mechanisms, such as HTTPs. Following a service-oriented architecture (SOA) model, each service offers its API interfaces to any other service in the environment.
Fragmenting applications into their most basic services enables the continuous delivery/deployment of large, complex applications by removing barriers and silos that previously lengthened the application release cycle. It’s been well-studied that elite DevOps performers release software multiple times per day. With microservices-based applications, organizations can evolve their technology stacks for modern cloud environments and operate at cloud-scale. With microservices, you can build, manage, scale, and reuse services independently; resolve issues faster; increase the rate of deployments; and ultimately deliver an enhanced end-user experience.
In order to determine which components of an application can be broken into microservices, you must deploy instrumentation on all tiers and components of the target application. Afterward, you’ll be able to determine baseline application performance, quantify transaction volumes, and gather other key metrics that will determine where you begin your microservice journey.
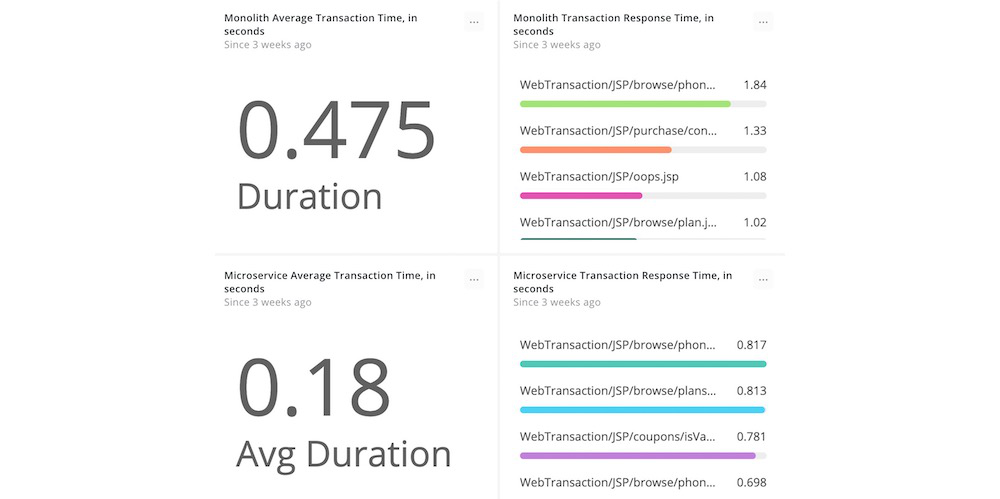
Compare application performance before and after migrating to microservices.
Promote a culture of experimentation, and do it confidently
As with any innovation, it’s not just about the technology. Updating processes and teaming practices is essential to the long-term success of technology modernization. Promote a culture of experimentation in your complex, distributed systems so your teams can experiment confidently, troubleshoot errors, and create measurable results. Specifically, mobilize around a solution that will enable your teams to:
- Set up proactive alerting and incident orchestration
- Measure the impact of deployments
- Analyze distributed systems
Set up proactive alerting and incident response
Proactive alerting strategies enable you to respond to problems before they affect your customers. A great place to start with alerting is with your team’s SLOs. In fact, you can group SLOs together logically to provide an overall Boolean indicator of whether your cloud-based service is meeting expectations or not—for example, “95% of requests complete within 250 ms and service availability is 99.99%”—and then set an alert against that indicator.
By breaking down the quantitative performance metrics of a cloud-based service or technology, you can identify the most appropriate alert type for each metric. For instance, you could set an alert to notify on-call responders if web transaction times exceed a half-millisecond, or if error rates surpass 0.20%.
For a simple alerting framework, consider the following table:
| Questions | Metrics and KPIs |
| Are we open for business? | Use synthetic monitoring to set up automated pings and alert on availability. |
| How’s our underlying infrastructure? | Manage and troubleshoot your hosts and containers with infrastructure-based monitoring. |
| How’s the health of our application? | Use real end-user metrics to understand your application’s backend performance. Use metric and trace data from open source tools, and display that information alongside all the other systems and services data you’re managing. |
| How do I troubleshoot a system error? | Use logs or distributed tracing to search and investigate the root cause across your applications and infrastructure. |
| How’s the overall quality of our application? | Use an Apdex score to quickly access an application’s quality. |
| How are our customers doing? | Monitor front-end and mobile user experiences. |
| How’s our overall business doing? | Focus on key transactions within an application and tie them to expected business outcomes to correlate application and business performance. |
Alerting without the proper broadcasting methods leaves you vulnerable. Your alerting strategy should include a notification channel to ensure the appropriate teams are notified if your application or architecture encounters issues.
We recommend that you first send alerts to a group chat channel (for example, using Slack or PagerDuty). Avoid alert fatigue by evaluating alerts in real time for several weeks to understand which alerts are indicative of important or problematic issues. These are the types of alerts that warrant waking up someone.
Make sure that communications during critical incidents take place in easily accessible and highly visible channels. A group chat room dedicated to incident communication is often a great choice. This allows all stakeholders to participate in or observe conversations, and it provides a chronology of notifications, key decisions, and actions for postmortem analysis.
Automation of simple or repeatable incident response tasks will increase efficiency and minimize the impact of incidents. With proper automation in place, you can disable or isolate faulty application components as soon as an alert threshold is reached, rather than after a notification has been issued.
Finally, after the incident has been resolved, key stakeholders and participants must capture accurate and thorough documentation of the incident.
At a minimum, we recommend that the documentation for the incident retrospective includes:
- A root-cause analysis
- A chronology and summary of remediation steps and their results and whether they were successful or not
- A measure of the impact to the business in terms of user experience and financial losses, if applicable
- Recommendations for system or feature improvements to prevent a recurrence
- Recommendations for process and communication improvements
Track metrics before and after deployments
Proper instrumentation gives you full visibility into the impact of the changes you make in your cloud native environment. Capturing tangible, measurable metrics before and after each deployment allows you to optimize changes in isolation and reduce the impact to other work occurring in your environment.
To effectively measure the impact of deployments, follow these steps:
-
Integrate measurements into your CI/CD process. With appropriate measurements incorporated into all phases of your development cycle, you can surface errors and performance issues before your customers uncover them. As your application teams plan their work, use your KPI in daily stand-ups and other planning meetings to analyze necessary debugging work, assess whether recent deployments were successful, and prioritize other efforts.
-
Add automated deployment markers. It's important to track deployments and the impact code and infrastructure changes have on your end-user experience. A deployment marker is an event indicating that a deployment happened, and it's paired with metadata available from your source code management system (for example, the user, revision, or change-log). These markers—and the associated metadata—can be tracked on charts and graphs at the deployment event's time stamp.
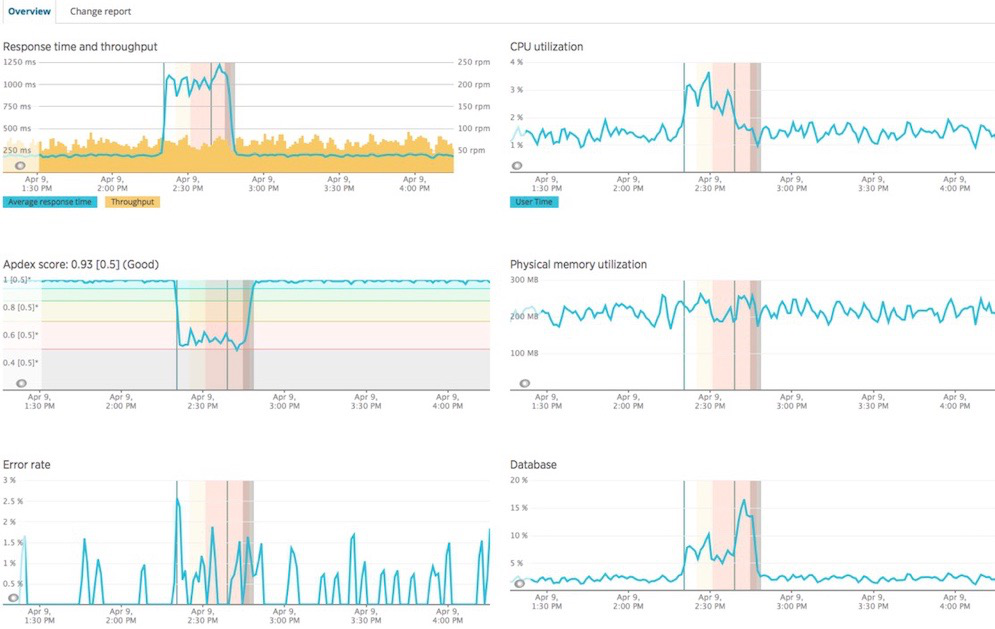
Understand how deployments affect system performance.
3. Gather insights from your deployment pipeline. An important part of optimizing your cloud native environment is making a cultural shift toward smaller, more frequent changes to your code and infrastructure. Test and gather appropriate performance insights about your deployment pipeline to more clearly understand the impact of the changes you make. Code changes should be as small as possible in terms of the number of lines of code and source files you change. Changes should also involve as few team members as possible. This makes it much easier to identify issue owners and determine root causes when errors occur.
Analyze distributed systems
In a monolithic application, a simple stack trace can contain enough diagnostic data to determine the root cause of a code defect. But cloud computing and microservices have blurred the lines between software and infrastructure. In modern architectures, requests are distributed across many smaller services—often with ephemeral lifespans—hosted both in on-premises and in cloud environments. As such, spotting code defects in cloud native environments becomes a much more complex endeavor.
Monitoring solutions that support distributed tracing provide a wealth of context when you need to troubleshoot distributed systems. But distributed traces are just one component of a well-monitored system. You need a holistic view of your cloud native environment, especially when tracking the root cause of a defect, as there are volumes of data to evaluate and understand. When managing microservices, it’s critical that you have the capability to spot bottlenecks and problem spans quickly so that you don’t compromise your mean-time-to-resolution (MTTR) or end-user experience.
So, what should you measure? In Google’s ebook “Site Reliability Engineering: How Google Runs Production Systems,” the authors suggest using the “Four Golden Signals” to measure and improve user-facing applications:
- Latency: How responsive is your application?
- Traffic: How many requests or sessions are aimed at your application?
- Errors: How much traffic is unable to fulfill its requests or sessions?
- Saturation: How are resources being stressed to meet the demands of your application?
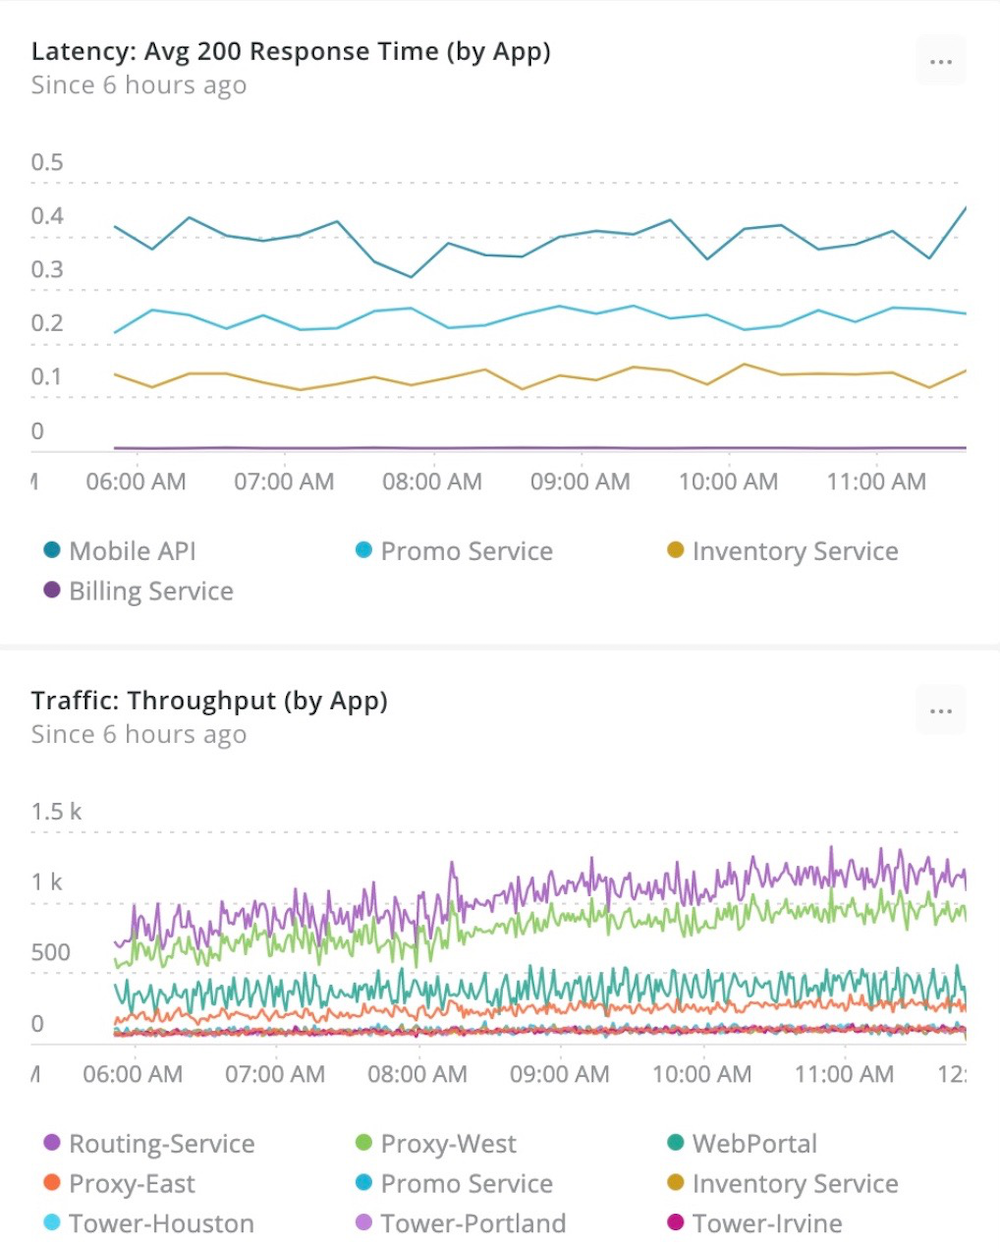
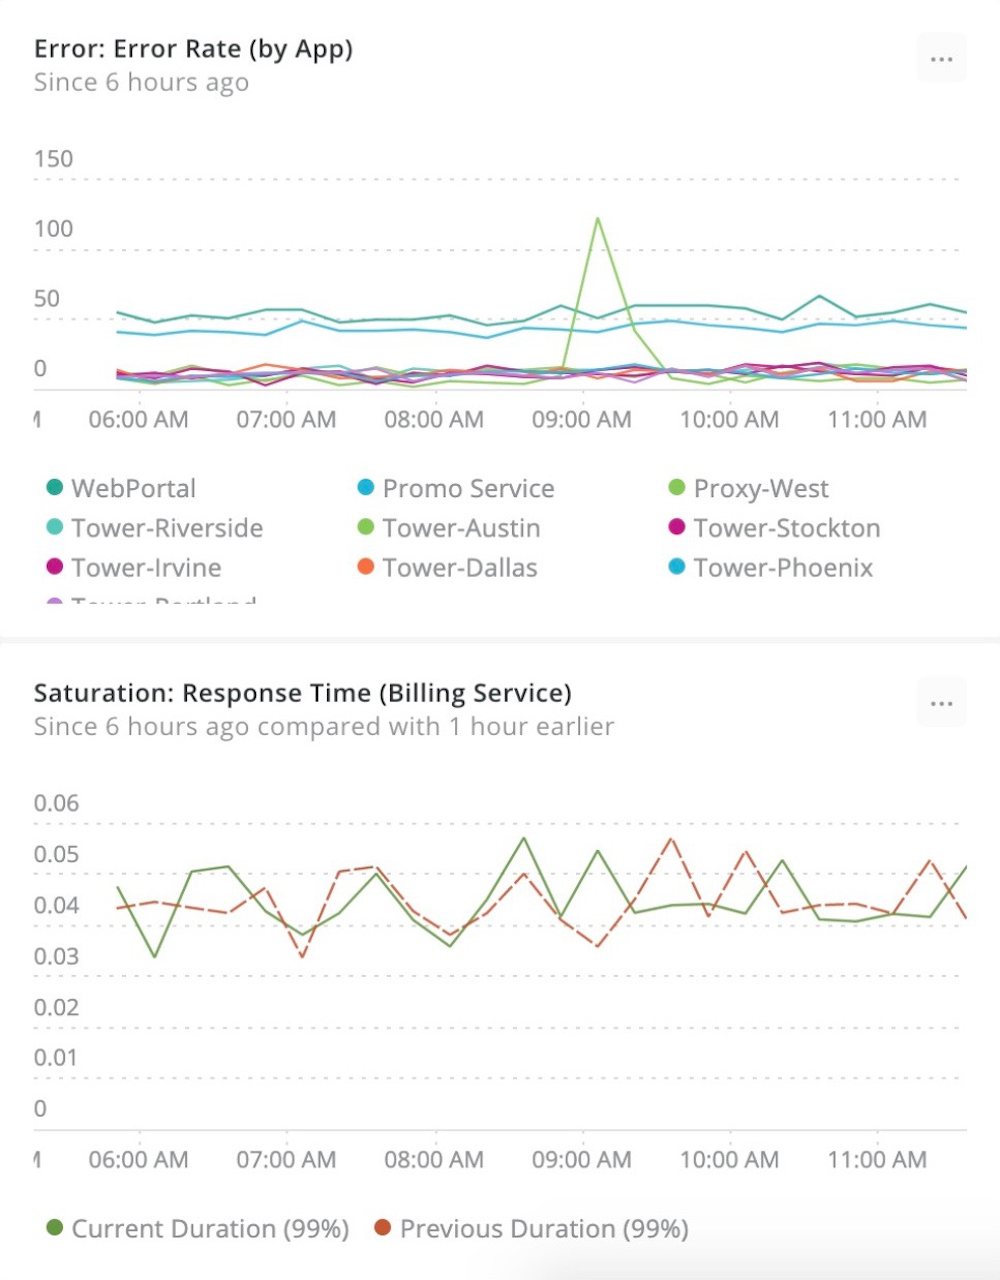
Use the “Four Golden Signals” to measure and improve user-facing applications.
By focusing on metrics such as the “Four Golden Signals,” you’ll get proof of measurable improvements that you can share throughout your organization to gain momentum on your cloud native journey.
Scale your application—from the underlying host to the customer experience
As your cloud native system dynamically scales, maintaining control and visibility into the resources you use and their impact on your budgets becomes increasingly problematic. Once again, modern monitoring plays a critical role. You need to proactively monitor nodes, deployments, pods, and containers as well as the frontend and backend applications to understand the custom experience and avenues for cost optimizations. To effectively scale your cloud applications, you must:
- Manage your containerized environment
- Improve customer experience
- Optimize your cloud architecture and spend to continuously improve your cloud native environment
Manage your containerized environment
Widespread adoption of containers has changed the way applications are written and deployed. Container orchestration technologies such as Kubernetes are making it easier for teams to schedule, deploy, and manage their containerized applications. But three challenges still exist that require teams to rethink their environment and application monitoring strategies:
Challenge 1: Often organizations adopt containers as they break down monolithic applications into multiple microservices. This introduces new complexity and the sheer scale and dimensionality of containers is hard to conceptualize in an easy-to-understand format.
Challenge 2: Containers are ephemeral by nature and are deployed in dynamic, constantly evolving environments. Your application might be running in one container or pod or node—but a few minutes later, it could be running in an entirely different container. A modern approach to monitoring can help you keep track of such dynamic environments.
Challenge 3: Delivering a differentiated end-user experience is a key initiative for all organizations, and many organizations are adopting container-based workflows in order to release better software, faster. But with this tremendous opportunity comes risk, because every time a new container is deployed, the cluster is impacted. You need context into how such infrastructure changes impact your application stack, and how changes to both the infrastructure and application stack affect the end-user experience. Getting all of this data in real time in a digestible format is a significant challenge in distributed, containerized environments.
Modern environments require modern monitoring. Teams need a platform that enables them to drill down into Kubernetes data and metadata in a high-fidelity, curated UI that simplifies complex environments. Such a platform can help teams move beyond infrastructure metrics and investigate deeper into applications, traces, logs, and events—with a single click—while staying grounded in a centralized UI. Containerized environments are complex, and with the right context, teams are empowered to troubleshoot distributed environments faster.
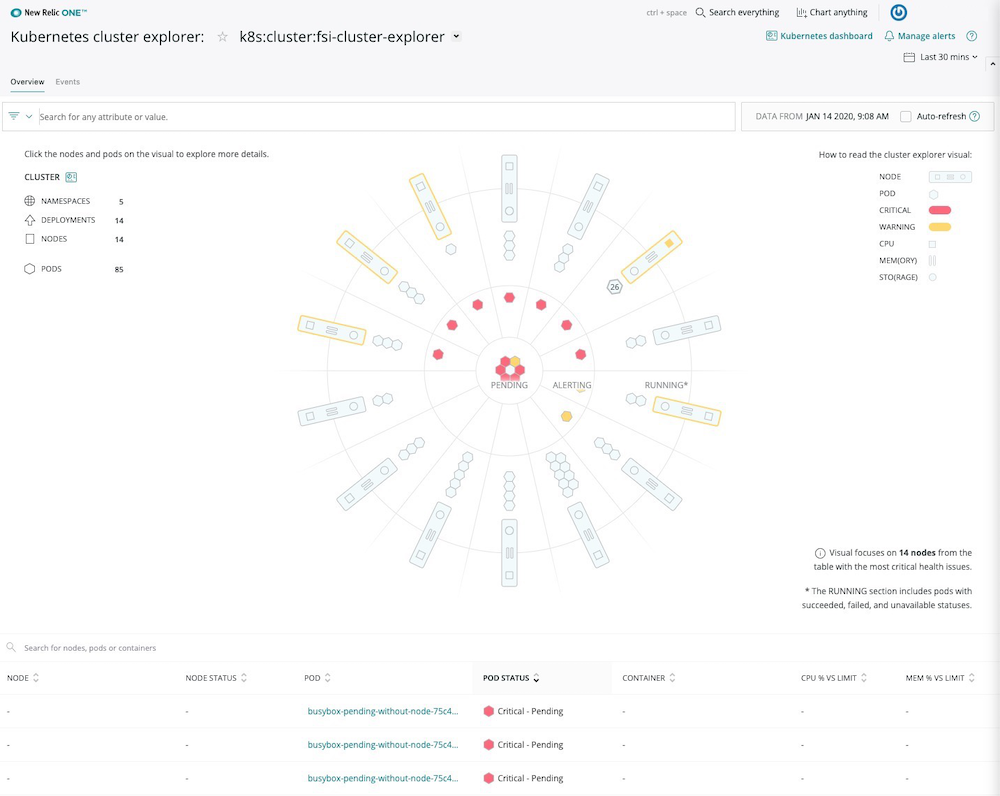
Intuitively investigate metrics, events, logs, and traces across your entire Kubernetes environment.
Improve customer experience
An efficient, well-functioning cloud native environment enables organizations to make rapid, frequent releases and product changes. Getting observability into these environments enables you to share data about your customer experience with other stakeholders, such as customer service, support, sales, and marketing teams.
A single point of reference, such as a dashboard, brings together business-level information alongside performance data—and makes it all very easy for you to share across teams. When determining how or with whom to share your dashboards, consider the following questions:
-
Which teams are responsible for applications that have high levels of end-user interaction?
-
Which non-engineering teams could benefit from end-user analysis that includes performance metrics?
-
Customer support: Could customer issues be resolved faster?
-
Product/engineering: Could product make more informed road-map decisions?
-
Customer success: Can this data be used to make customers more successful?
-
Others: Could other teams benefit from your dashboards?
-
A clear understanding of what creates a successful customer experience will help you drive greater efficiencies in your work efforts and, in turn, deliver greater productivity.
Optimize your cloud architecture and spend to continuously improve your cloud native environment
In the cloud, it’s important to look regularly and closely at how your applications and services are architected and utilized. You need to identify opportunities for right-sizing your instances, fine-tuning your databases, modifying your storage usage, better configuring your load balancers, or even re-architecting your applications.
For example, if you have a set of 20 instances all running at 10% CPU usage, you might consider using smaller instances or consolidating more work onto those instances. This kind of thinking about your cloud utilization and spend will help you optimize your environment and justify your cloud budget.
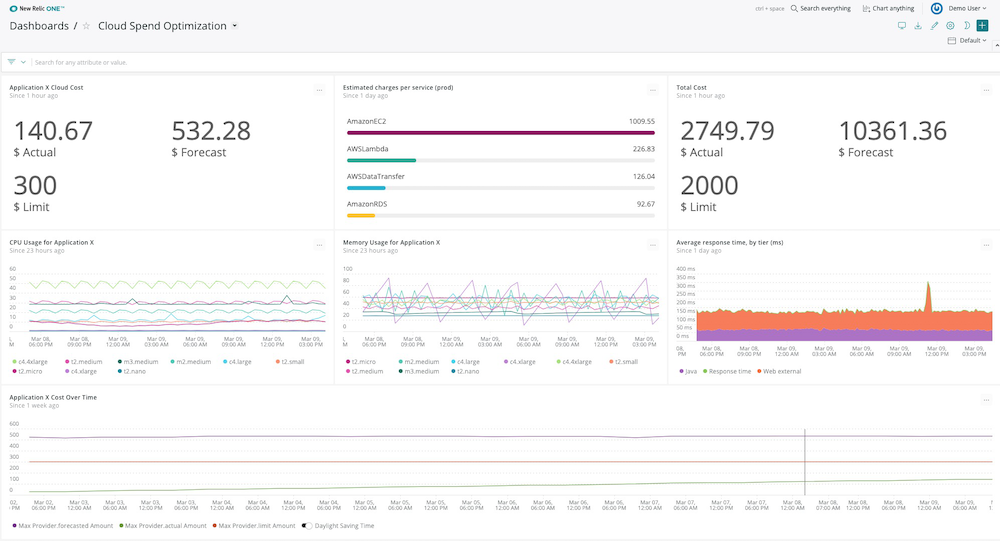
This dashboard shows data broken out by services and budgets, as set up in the AWS budgeting area.
Optimize your cloud architecture with three main goals in mind:
- Improve performance, availability, and end-user experience by taking better advantage of cloud services.
- Optimize your cloud spend, striking the delicate balance between cost and performance.
- Capture business and technical metrics that support your current cloud spend and can justify a larger cloud budget as growth dictates.
Conclusion
Whether you were “born in the cloud” or have recently migrated on-premises applications to the cloud, you likely still have plenty of work to do to optimize your modern cloud environment.
An optimized cloud native environment will promote faster feature delivery, fewer incidents, more experimentation, and competitive advantage. Our prescriptive guide to Optimizing Your Cloud Native Environment—written by New Relic solutions engineers and cloud experts—provides details about how you can use New Relic to track every step of your cloud native journey and increase the odds of your success.
New Relic’s flexible and scalable platform helps you manage, troubleshoot, and optimize distributed systems with ease. From overall system health metrics down to individual distributed traces, we give you real-time insights across every aspect of your dynamic environment. Leverage modern cloud tools with confidence and stability to push your business forward, faster.
Deliver more perfect software
Try New Relic One today and start building better, more resilient software experiences.


